Please login or create an account to join the discussion.
Blue fertilizer pellets lay scattered on the ground amongst leaves, grass and soil. Photo by Sean Foster via Unsplash.

Nitrogen in the Food System

A flyer for the TABLE explainer by Rasmus Einarsson called "Nitrogen in the Food System" with an image of a cutout letter "N" with ferns growing through.

Nitrogen plays a dual role in the agri-food system: it is an essential nutrient for all life forms, yet also an environmental pollutant causing a range of environmental and human health impacts. 

In this explainer, we explore ways of thinking about nitrogen, the roles both livestock and synthetic nitrogen fertilizer play in the food system, and the current policy targets for reducing nitrogen emissions. 

https://www.doi.org/10.56661/2fa45626

Nitrogen (N) plays a dual role in the agri-food system: it is an essential nutrient for all life forms, yet also an environmental pollutant causing a range of environmental and human health impacts. As the plant nutrient needed in greatest quantities, and as a building block of proteins and other biomolecules, N is a necessary part of all life. In the last century, an enormous increase of N turnover in the agri-food system has enabled increasing per-capita food supply for a growing world population, but as an unintended side effect, N pollution has increased to levels widely agreed in science and policy to be far beyond sustainable limits.

There is no such thing as perfectly circular N supply. Losses of N to the environment inevitably arise as N is transformed and used in the food system, for example in soil processes, in manure storage, and in fertilizer application. This lost N must be replaced by ‘new’ N, which is N converted to bioavailable forms from the vast atmospheric pool of unreactive dinitrogen (N2). New N comes mainly as synthetic N fertilizer and through a process known as biological N fixation (BNF). In addition, there is a large internal flow of recycled N in the food system, mainly in the form of livestock excreta. This recirculated N, however, is internal to the food system and cannot make up for the inevitable losses of N.

The introduction of synthetic N fertilizer during the 20th century revolutionized the entire food system. The industrial production of synthetic N fertilizer was a revolution for agricultural systems because it removed the natural constraint of N scarcity. Given sufficient energy, synthetic N fertilizer can be produced in limitless quantities from atmospheric dinitrogen (N2). This has far-reaching consequences for the whole agri-food system. The annual input of synthetic N fertilizer today is more than twice the annual input of new N in pre-industrial agriculture. Since 1961, increased N input has enabled global output of both crop and livestock products to roughly triple. During the same time period, total food-system N emissions to the environment have also more than tripled.

Livestock production is responsible for a large majority of agricultural N emissions. Livestock consume about three-quarters of global cropland N output and are thereby responsible for a similar share of cropland N emissions to air and water. In addition, N emissions from livestock housing and manure management systems contribute a substantial share of global N emissions to air.

There is broad political agreement that global N emissions from agriculture should be reduced by about 50%. High-level policy targets of the EU and of the UN Convention on Biological Diversity are for a 50% reduction in N emissions. These targets are in line with a large body of research assessing what would be needed to stay within acceptable limits as regards ecosystem change and human health impacts.

In the absence of dietary change towards less N-intensive diets, N emissions from food systems could be reduced by about 30%, compared to business-as-usual scenarios. This could be achieved by implementing a combination of technical measures, improved management practices, improved recycling of wasted N (including N from human excreta), and spatial optimization of agriculture.

Human dietary change, especially in the most affluent countries, offers a huge potential for reducing N emissions from food systems. While many of the world’s poor would benefit nutritionally from increasing their consumption of nutrient-rich animal-source foods, many other people consume far more nutrients than is necessary and could reduce consumption of animal-source food by half without any nutritional issues. Research shows that global adoption of healthy but less N-polluting diets might plausibly cut future food-system N losses by 10–40% compared to business-as-usual scenarios.

There is no single solution for solving the N challenge. Research shows that efficiency improvements and food waste reductions will almost certainly be insufficient to reach agreed environmental targets. To reach agreed targets, it seems necessary to also shift global average food consumption onto a trajectory with less animal-source food.

Nitrogen (N) plays a dual role in agri-food systems: it is essential to agricultural production but it is also an environmental pollutant. As the plant nutrient required in the largest quantities and a building block of proteins and other biomolecules, N is crucial for food production and human nutrition. Simultaneously, N emitted to the environment in various forms is an inevitable side effect of agricultural production and it causes harms to the environment and human health which rank as some of the most pressing problems arising from modern agriculture.

The large-scale introduction of synthetic N fertilizer during the 20th century was a revolution for agriculture. In pre-industrial agriculture, N was scarce. For thousands of years, the main agricultural input of N, apart from manure N (which merely recirculates N contained in livestock feed), was supplied by legume crops which partner symbiotically with specialized soil bacteria that convert atmospheric dinitrogen (N2) into bioavailable forms. Legumes can be an excellent source of N, but quantitatively this source is limited by agricultural land availability, creating a constraint on the amount of cereals, vegetables, and other non-fixing crops that could be grown. This N limitation was in principle overcome by the invention of synthetic N fertilizer in the early 1900s, with enormous consequences for the global agri-food system. Synthetic N fertilizer use accelerated during the 20th century: since 1960, global synthetic N fertilizer use increased about tenfold; since ca. 1980 it supplies more than half of cropland N input; and today it is by far the main source of agricultural N and a main driver of agricultural productivity. Synthetic N fertilizer has been an essential enabler of steadily increasing global per-capita food supply in the context of a world population that grew from three billion in 1960 to eight billion in 2022.

As an unintended side effect, however, the increased turnover of N in the food system has led to unprecedented quantities of N emitted into ecosystems and the atmosphere, with long-term consequences that are as yet only partially understood. As an environmental pollutant, N contributes to eutrophication, greenhouse gas fluxes, stratospheric ozone depletion, and toxic air pollution, at a scale that scientists and global decision-makers agree is far beyond sustainable limits.

Humanity is therefore facing a dilemma. From an environmental perspective, N pollution needs to be reduced very substantially. But from an agricultural perspective, N supply is crucial to ensure production, and it is not immediately clear whether the necessary reductions can be made without economic costs, dietary shifts, and/or productivity losses that societies are unwilling to accept.

This explainer provides a tour of the agri-food system, what it produces and at what environmental cost, viewed through the lens of the N cycle. The text is organized as follows. Section 2 outlines the sources, recirculation, and emissions of N in agri-food systems. Section 3 gives a quantitative overview of N flows in the global agri-food system and how these have developed since 1961. Section 4 takes a closer look at N sources in agriculture: the ‘new’ N introduced by synthetic N fertilizer and by legumes, and the recirculated N provided by manure and other organic amendments. In particular, Section 4 explains how these N sources have developed over time, how they complement each other, and their different effects on soil health. Section 5 is about N emissions and resulting environmental and health impacts: how large are the emissions, what impacts do they cause, and how much is ‘too much’ according to science and international policy? Section 6 describes three approaches to mitigating N-related impacts: efficiency improvements, spatial reorganization of agriculture, and dietary change. Section 7 draws some tentative conclusions about the prospects for supplying a world population of 10 billion with food while returning the N cycle to within sustainable bounds. In particular, Section 7.1 explores the possibility for a future food system without synthetic N fertilizer, and whether that would be preferable; Section 7.2 asks what would be needed to reach agreed political targets for N pollution; and Section 7.3 summarizes the main trade- offs humanity is facing in terms of agricultural productivity, land use, and N pollution. Section 8 concludes with a few reflections and a look to the future. Three boxes provide additional detail on the N and carbon cycle (Box 1), the turnover of N in livestock production (Box 2), and the similarities and differences between N and phosphorus (P) as nutrients and environmental pollutants (Box 3).

This explainer is primarily about biophysical aspects of food systems. It only briefly touches on the many related economic, social, political, and moral constraints and implications. Navigating the future of N in agri-food systems requires deep thought about all of these dimensions. This text therefore does not provide much by way of definitive answers about the future. The hope is merely that it will provide the reader with tools and knowledge to better understand the biophysical role of N as a puzzle piece in the agri-food system.

Viewed through the nitrogen (N) lens, the agri-food system can be thought of as comprising four components: soil, plants, livestock, and humans1. Plants take up N from the soil, then livestock eat plant N, which gets turned into manure N and food N available to humans in the form of meat, milk, and eggs. Humans consume N from plants and livestock, mostly in the form of protein, eventually excreting virtually all food N as urine and faeces2. As an inevitable side effect of crop and livestock production and waste management, N is emitted to the environment in different forms (see Section 5). These flows are illustrated in Figure 1.

Illustration of the main nitrogen (N) flows in the agri-food system. The soil-plant system receives recycled N, mainly in manure, and new N, mainly in synthetic fertilizers and through biological N fixation (BNF). There is also some soil N input through atmospheric deposition (NH× and NOy in the diagram). Plant N is directly consumed by humans or transformed by livestock to food products and manure. Emissions of dinitrogen (N2), ammonia (NH3), nitrate (NO3−), nitrogen oxides (NO and NO2, collectively NO×),

Figure 1: Illustration of the main nitrogen (N) flows in the agri-food system. The soil-plant system receives recycled N, mainly in manure, and new N, mainly in synthetic fertilizers and through biological N fixation (BNF). There is also some soil N input through atmospheric deposition (NH× and NOy in the diagram). Plant N is directly consumed by humans or transformed by livestock to food products and manure. Emissions of dinitrogen (N2), ammonia (NH3), nitrate (NO3−), nitrogen oxides (NO and NO2, collectively NO×), and nitrous oxide (N2O) emanate mainly from manure management systems, from soils, and from waste treatment (red arrows).

Plants mainly take up N in chemically inorganic forms, from which they synthesize protein and other organic N compounds (see Box 1). Since most N in plants and animals is protein, and protein is about 16% N, an approximate conversion is commonly calculated as protein = 6.25 × N [12].

The soil-plant system receives both recycled N and ‘new’ N. Recycled N comes in the form of livestock manure, human excreta, composted food waste, etc. New N comes mainly in the form of synthetic N fertilizers and through a process known as biological N fixation (BNF).

The starting point for both synthetic N fertilizers and BNF is an atmospheric gas called dinitrogen (N2), which makes up about 78% of the atmosphere. BNF is a natural process whereby microbes convert N2 gas to ammonium (NH3), which can then be taken up by soil microbes and plants. Synthetic fertilizers are produced from the same atmospheric N2 gas, but using the energy-intensive Haber-Bosch process3, a chemical process discovered in 1909 and which later came to revolutionize farming (see Sections 3 and 4). In addition to these major sources of N, some new N is added through atmospheric deposition of N oxides (NO and NO2, collectively NO×) which are created from atmospheric N2 by high-temperature combustion (diesel engines and power plants) and by lightning4.

Reactive N (sometimes written Nr) is a term for all N forms except N2. The reason for making this distinction is that N2, due to its triple bond N≡N, is very unreactive, whereas most other forms of N are readily transformed through chemical reaction. Conversion of N2 to reactive N, also known as N fixation, takes a lot of energy5.

In other words, although N surrounds all life in enormous quantities as atmospheric N2, it is mostly unavailable as a nutrient. In the natural environment, N2 is converted to reactive N only in limited quantities, by BNF and by lightning. Reactive N is therefore scarce in the natural environment, and it is usually a main limitation to growth of plants and microbes, and thereby ultimately for all life. This is the crucial limitation that was removed by the Haber-Bosch process in the early 1900s.

So N2 – the form of N that makes up 78% of the atmosphere – isn’t itself an environmental pollutant. But the reactive N forms are. Environmental N emissions occur throughout the agri-food system. Figure 1 shows the environmentally and agronomically most important emissions: NH3, N2, NO×, and nitrous oxide (N2O) to the atmosphere, and nitrate (NO3−) to groundwater and surface water. Read more about the mechanisms and impacts of these emissions in Section 5.

N emissions are also interchangeably called ‘N losses’ or ‘N waste’. The exact definitions of these terms vary in the literature, but usually include all reactive N, and sometimes N2 too. In this text, these terms include all N emissions including N2, unless reactive N is specifically mentioned.

It is important to emphasise that there is no such thing as a completely circular N supply. Although recycled N plays an important role in the agricultural N cycle, and although much could be done to improve this recycling and reduce N losses (Section 6), some losses are inevitable. Therefore, as a basic fact of mass conservation, new N must be added through industrial and/or biological fixation to replace the lost N. This has deep implications for the food system which are explored in the coming sections.

Box 1: The coupled nitrogen and carbon cycles

The nitrogen (N) and carbon (C) cycles are interconnected in many ways that determine the productivity and environmental effects of agri-food systems. This box takes you on a tour of the coupled N and C cycles6.

Nitrogen as part of biomolecules

N is essential for all known life forms because it forms part of many biomolecules including proteins (enzymes, hormones, and structural tissues such as bone and muscle), ATP (a biochemical energy carrier), and nucleic acids (DNA and RNA, the genetic code molecules). Any biological activity therefore involves a constant turnover of N. All life forms consume N in some form.

Autotrophs such as plants and cyanobacteria are organisms that mainly consume inorganic N, such as ammonium (NH4+) and nitrate (NO3), and atmospheric carbon dioxide (CO2) to synthesize proteins, carbohydrates, and other biomolecules using sunlight energy. These organisms are net producers of organic compounds such as protein and carbohydrates.

By contrast, heterotrophs such as animals, fungi, and many bacteria and other microbes are organisms that mostly consume carbohydrates and organic N, in particular protein, from other organisms. Heterotrophs are net consumers of protein, eating mostly organic N and excreting a mix of organic and inorganic N.

Nitrogen for energy supply and other microbial uses

N is also used by some microbes as their primary source of energy. In agriculture, there are two very important examples of this.

One is nitrification, which is the oxidation of NH3 to nitrite (NO2) and nitrate (NO3). This oxidation releases energy and some microbes live on the energy harvested from these reactions. This can be seen as ‘burning’ NH3 (in the presence of oxygen) as fuel to harvest energy, except that the oxidation happens stepwise and at room temperature, catalysed by specialized enzymes. The fully oxidized end result of nitrification is NO3, but some microbes use intermediate forms to produce nitrous oxide (N2O). Thus, nitrification can release some N2O as a by-product.

The other energy use of N is denitrification, which is when specialized microbes use N compounds instead of oxygen to oxidize or ‘burn’ carbohydrates and other energy-rich materials. While oxidizing the energy- rich materials, the denitrifying microbes transform NO3 via NO2, nitric oxide (NO), nitrous oxide (N2O) and finally to dinitrogen (N2). Denitrification in soil is encouraged by high NO3 concentrations and oxygen deprivation, which can result after heavy rains or during freeze-thaw cycles during winter.

Incomplete denitrification leads to N2O emissions. In most cases, the majority of nitrate is converted to N2, but this varies depending on how severe the oxygen depletion is. In wetlands and flooded soils, N2O is only about 2% of denitrified N, but in agricultural soils it is more typically around 10% [21].

Nitrification and denitrification are two of many reactions that are microbially mediated, i.e., catalysed by microbes using specific enzymes. There are many other examples of microbially mediated reactions, for example anaerobic ammonia oxidation (anammox) and dissimilatory N reduction to ammonia (DNRA), that play curious and important roles in the N cycle.

A reason to focus on nitrification and denitrification here is that these reactions transform a lot of N in agri-food systems: in soils, manure management systems, and wastewater treatment. They are also very important processes in generating emissions of NO3 and N2O.

Chemical overview of the nitrogen (N) cycle, showing the most important biological functions of N. Ammoniacal N (ammonia, NH3, and ammonium, NH4+) is the raw material for proteins and other biomolecules (organic N), and ammoniacal N is also the endpoint of mineralization (decomposition) of organic N. In nitrification, ammoniacal N is used as energy source as it is oxidized to nitrate (NO3−). In denitrification, NO3− is transformed via nitrite (NO2−), nitric oxide (NO), nitrous oxide (N2O), and finally to di

Figure 2: Chemical overview of the nitrogen (N) cycle, showing the most important biological functions of N. Ammoniacal N (ammonia, NH3, and ammonium, NH4+) is the raw material for proteins and other biomolecules (organic N), and ammoniacal N is also the endpoint of mineralization (decomposition) of organic N. In nitrification, ammoniacal N is used as energy source as it is oxidized to nitrate (NO3). In denitrification, NO3 is transformed via nitrite (NO2), nitric oxide (NO), nitrous oxide (N2O), and finally to dinitrogen (N2). Biological N fixation (BNF) and industrial N fixation both produce NH3 from N2.

The eye of the needle

Microbes in the N cycle also play a crucial role in the decomposition of proteins and other organic molecules. Microbially mediated degradation of organic N to ammonium (NH4+), also known as mineralization, makes N easily available for uptake by autotrophs such as plants. Living microbial biomass, which makes up a very small share of soil organic matter, was described by David Jenkinson at Rothamsted Research in the late 1960s as the ‘eye of the needle through which all organic matter entering the soil must pass’ [22]. The ‘eye of the needle’ was and is a rich and active area of research of utmost importance for agronomic and agri-environmental applications [22,23].

Coupling between the carbon and nitrogen cycles

The previous subsections have given several examples of how the N and C cycles are interdependent: autotrophs consume inorganic C and N to produce organic compounds; heterotrophs consume organic C and N from other organisms; denitrifiers use N as an electron acceptor to harvest energy from organic C; and so on.

A quantitatively clear connection between C and N is that the ratio of C to N in biomass is constrained as a basic fact of what tissues are made of. For example, carbohydrates including starch and cellulose are about 45% C and no N, and protein is about 45% C and 16% N. Woody biomass typically has about 50– 100 kg C per 1 kg N, i.e., a carbon-to-nitrogen ratio (C:N ratio) of 50–100. Grass is more N rich, with C:N ≈ 20. Potatoes have C:N ≈ 30, wheat flour C:N ≈ 15, and beans and lentils C:N ≈ 6-10. Soil microbes have C:N ≈ 8. Long-term soil C storage is mostly dead organic matter with C:N ≈ 8–15 [24–26], and therefore soil C sequestration also requires soil N sequestration, roughly 1 kg N per 10 kg C.

There are many more connections which lead to complex and sometimes surprising effects. For example, N addition to natural ecosystems can often increase growth and C accumulation (see Section 5.3), but this is complicated by so-called priming effects where C and N addition lead to large changes in soil microbial activity, increasing or decreasing decomposition rates and thereby the net C accumulation.

Where does all the nitrogen go?

In the last century, anthropogenic N fixation, through industrial NH3 synthesis, agricultural BNF, and NO× formation by high-temperature combustion, has grown to almost twice the size of all natural terrestrial N fixation [21,27]. This results in enormous emissions of N, in different forms, to the environment, with geological-scale effects on ecosystems and atmospheric chemistry. Although much is known about effects on the environment, there are still major uncertainties about the long-term fate and effects of this increased N supply, many of which will certainly be resolved by future research.

All the N fixed from atmospheric N2 must eventually end up somewhere: it’s either denitrified and returned to the atmosphere as N2, or else accumulates in some other form.

In total, at least two-thirds of (anthropogenic and natural) N fixation is eventually denitrified to N2 or N2O [21,27]. The N2O, with an average atmospheric lifetime of about 100 years, is also eventually converted photochemically to N2. Since preindustrial times, denitrification has increased heavily, perhaps doubled, as a result of increased N emissions to the environment. The increased denitrification likely equals about half of the increased anthropogenic N fixation [21].

But there is also long-term N accumulation in the environment, which is as yet incompletely understood. Some N is buried in sediments in rivers, lakes, and the oceans, a process that has gone on for as long as the rivers have existed, but likely has been heavily accelerated in the last century, driven by anthropogenic N fixation and consequent N emissions to the environment [28]. In addition, an unknown amount of N is accumulating in vegetation, soils, and groundwater; and also this process has been accelerated by increased N fixation in the last century: in some intensive agricultural areas, it has been suggested that such terrestrial N accumulation could currently equal about 50% of total N input [21,29].

Summary

This box has outlined the main transformations in the N cycle. It has also shown how the C and N cycles are interdependent. A recurring theme is the importance of microbes in transforming N between different forms. There is an enormous diversity of microbes that mediate different reactions using specialized enzymes. Microbes are ‘the eye of the needle’, through which all organic matter must pass, and understanding the functions of microbes is therefore key to understanding turnover and accumulation of C and N in the environment.

  1. Variants of this multi-compartment model of N flows in agri-food systems are found in the research literature. Some prominent examples are given in Refs. [1–8] and references therein. A more detailed model could also account for crop residues (mostly returned to fields, but sometimes burned), non-food products such as biofuels and textile fibres (which contain almost no N), and N in food waste (sometimes recycled, but often incinerated or landfilled) [5,9–11].
  2. Over the course of an average life, humans excrete more than 99% of ingested N in urine and faeces. A 70 kg adult male body contains about 10.5 kg protein (containing about 1.7 kg N, using the approximate conversion factor protein = N × 6.25). Assuming a lifetime average protein consumption of 70 g/day (about 11 g N/day) and a lifespan of 75 years, the lifetime consumption is 1.9 tonnes protein (about 300 kg N). The share of ingested N retained in the body in this example is therefore about 0.6%.
  3. The Haber-Bosch process is the main method for industrial synthesis of ammonia (NH3) from dinitrogen (N2) and hydrogen (H2): N2 + 3 H2 → 2 NH3. Other N compounds can then be industrially produced from NH3. For example, nitric acid (HNO3), an important step in the manufacture of nitrate-containing fertilizers such as ammonium nitrate (NH4NO3).
  4. In addition to the atmospheric deposition of N oxides (NOx), there is also deposition of chemically reduced nitrogen forms, mainly ammonia (NH3) and ammonium (NH4+). Most of this reduced nitrogen has previously been emitted as ammonia from agriculture. Therefore deposition of reduced nitrogen is not new nitrogen in the same sense as nitrogen oxides which mainly are created from atmospheric dinitrogen (N2).
  5. Energy is involved in two distinct ways here. First, there is the activation energy required to break the triple bond in N2, which is then partially or fully recovered as another bond is formed. Second, there is the question of overall reaction energy change. For example, the reaction N2 + 3 H2 → 2 NH3 used to produce synthetic N fertilizers is actually slightly exothermic, i.e., it gives off some (heat) energy. But obtaining the H2 ingredient is energy expensive, typically produced from fossil fuels, or could alternatively be made from water using electricity. In total, industrial NH3 synthesis accounts for 1–2% of global primary energy use.
  6. The N and C cycles are documented in many good textbooks and review papers. The overview here is largely based on Refs. [13,14] and sources therein; in particular Refs. [15–20]. A few additional references in the text point to quantitatively uncertain results.

Global nitrogen (N) flows in the agri-food system have changed enormously in the last century. Figure 3 shows some key trends from 1961 to 2020.

Between 1961 and 2020, global food supply grew faster than world population. Figure 3 (panels b and c) shows global protein supply7 from vegetal and animal sources expressed as N content. Most of the N in food is in the form of protein, and the N content can be calculated using the approximate8 conversion formula protein = N × 6.25. While the world’s population grew by about 170% during this time, from three to eight billion, protein supply grew by 240% from 70 to 240 Mt protein/year (11 to 38 Mt N/year). Expressed per person, global protein supply increased from 61 to 85 g protein/person/day (3.6 to 4.9 kg N/person/year).

Over this time, food production increased mostly through intensification, i.e., yield increases to produce more food on the same area. As shown in Figure 3, global cropland harvests quadrupled from 1961 to 2020 (panel f), while cropland area (panel d) increased about 17% from 1.35 to 1.58 billion hectares (Gha). The global per-capita use
of cropland decreased by about 56% from 1961 to 2020 (panel e). The extreme increase in cropland productivity was made possible by a combination of crop breeding and other innovations, and increased use of inputs such as pesticides, irrigation, and fertilizers. From 1961 to 2020, cropland inputs of synthetic N increased tenfold, and since ca. 1980 synthetic N has accounted for more than half of total cropland N inputs (panels f and g).

Figure 4 shows a graphical representation of N flows in the global agri-food system in 1961 and 2013 [7]. It shows the flows of N between four compartments: cropland, permanent grassland, livestock, and human population.
The width of the arrows corresponds to the annual quantity of N flowing to and from compartments in the form of synthetic N fertilizers, BNF, manure, feed, food, and various environmental losses. This demonstrates that an enormous change in N turnover has taken place, enabled by increased input of both synthetic N fertilizer and BNF.

Figure 3 and Figure 4 suggest a few key observations about N in the agri-food system.

Figure 3: Key trends in global food protein supply and agriculture nitrogen (N) use 1961-2020. All N flows are expressed in million metric tonnes per year (Mt N/year). Protein is converted to N using the approximation protein = 6.25 x N. Cropland is the sum of arable land and permanent crops such as fruits, wine, and olives. Permanent grassland is pastures and meadows that have not seen tillage for at least five years. Data from the FAOSTAT database.

Figure 3: Key trends in global food protein supply and agriculture nitrogen (N) use 1961-2020. All N flows are expressed in million metric tonnes per year (Mt N/year). Protein is converted to N using the approximation protein = 6.25 x N. Cropland is the sum of arable land and permanent crops such as fruits, wine, and olives. Permanent grassland is pastures and meadows that have not seen tillage for at least five years. Data from the FAOSTAT database.

Figure 4: Nitrogen (N) flows in the global agri-food system in 1961 and 2013, following the Generalized Representation of Agri-Food Systems [6,7]. The width of arrows correspond to the size of annual flows. Numbers are in million metric tonnes per year (Mt N/year). Arrows pointing out from agricultural land, livestock, and human population represent N losses including dinitrogen (N2). Diagram adapted from [7] in collaboration with Luis Lassaletta.

Figure 4: Nitrogen (N) flows in the global agri-food system in 1961 and 2013, following the Generalized Representation of Agri-Food Systems [6,7]. The width of arrows correspond to the size of annual flows. Numbers are in million metric tonnes per year (Mt N/year). Arrows pointing out from agricultural land, livestock, and human population represent N losses including dinitrogen (N2). Diagram adapted from [7] in collaboration with Luis Lassaletta.

3.1 Livestock consume a large majority of global nitrogen harvests

A large majority of N removed from agricultural land (cropland and permanent grassland) is used as livestock feed. In total, Figure 4 shows that livestock consume about 85% of total N from agricultural land. This share was roughly constant over the period 1961–2013. Concerning cropland N harvests, the share going to livestock feed increased a little, from about 70% in 1961 to 77% in 2013. Read more in the TABLE Explainer on feed-food competition [30].

Many crops from cropland are processed into both food and feed. Important examples are oilseeds such as rapeseed and soybean [31], which are separated into oil (containing no N) and a protein-rich cake or meal (containing all the N) which is mostly used as livestock feed. Additionally, by-products from cereal milling, such as bran and middlings, are often used for feed while flour goes to human consumption. These processing steps are not explicitly shown in Figure 4, but implicitly they are represented by the arrows which only show N flows.

Permanent grassland, also known as permanent meadows and pastures, are defined in FAOSTAT and other international agricultural statistics as agricultural grasslands which have seen no soil cultivation for at least five years. There is a wide variation in the quality and management of permanent meadows and pastures: some are semi-natural pastures, only grazed and very extensively managed, and others are intensively managed meadows, heavily fertilized and harvested several times per year. Quantitative information about permanent grasslands is surprisingly limited, considering that they make up about two-thirds of global agricultural land (see Figure 3) [32]. The flows shown in Figure 4 are estimated based on ruminant livestock feed consumption [7], and although these estimates broadly agree with other research [5,33], it should be noted that there are large uncertainties around the role of permanent grasslands as users of N inputs and suppliers of feed N.

The majority of livestock feed N is excreted as manure N. Read more about the conversion efficiency of livestock in Box 2.

3.2 Different trends in crop, livestock, and food-system nitrogen use efficiency

In crop production, N use efficiency, measured as the N harvest divided by N inputs, steadily declined in most countries between the 1960s and the 1980s. Cheap fertilizers, inefficient methods, and limited concern for the environment often led to excessive fertilizer use and very large N losses. Since ca. 1990, many countries have stabilized or increased crop N use efficiency and it is likely that global crop N use efficiency will continue to increase [34].

In livestock production, feed N use efficiency has broadly increased in recent decades due to a combination of breeding efforts, increasingly precise feed formulations, and faster growth and an earlier slaughter age of animals which leads to a smaller share of feed used for metabolic maintenance. In addition, pigs and poultry, which intrinsically are more efficient converters of feed N (see Box 2) now account for a larger share of livestock production. Note that this definition of ‘efficiency’ only relates to the conversion efficiency of feed N to edible food N (protein), and does not account for differences in the types and quantities of land used [35,36].

The N use efficiency of the agri-food system, defined as the quantity of food N (except seafood) divided by total input of new N (from synthetic fertilizers and biological N fixation) has declined somewhat between 1961 and 2013, from 22% to 19%. In other words, only about one-fifth of the new N introduced to the agri-food system is transformed into food N supply. This food-system N use efficiency is strongly influenced by the share of animal- source food, since livestock production causes large N losses.

3.3 Human nitrogen excreta: a large and mostly unused resource

Human excreta contain about 30–40 Mt N/year globally, corresponding to about one-quarter or one-third of the N in global synthetic N fertilizer use. Only a few percent of human N excretion are currently returned to agricultural land. The vast majority is lost to the atmosphere as N2, N2O, or NH3, or to surface waters as NO3, in proportions that vary depending on the sanitation systems used [37]. In advanced wastewater treatment plants, which are today the dominant solution in high-income countries, the aim is to maximize denitrification of reactive N to N2. The N not denitrified in wastewater treatment plants is mainly discharged as NO3 to aquatic ecosystems. Is denitrification in wastewater treatment a good thing? Yes and no. On one hand, denitrification to N2 is a successful elimination of reactive N that could otherwise pollute the environment (e.g., as NO3); but from a wider systems perspective it can also be seen as a colossal waste of reactive N that could be safely recycled in agriculture given investment in appropriate technologies [38,39]. More on this in Section 6.

Box 2: Food, manure, and by-products from livestock

Livestock play an enormous role in the global N cycle, consuming about 85% of the N removed from agricultural land (Figure 4). Most of this N is excreted in livestock urine and faeces, and a smaller part is transformed into milk, eggs, or tissue growth. Given the large share of N excreted, the way livestock excreta are managed have large implications for emissions and, if done well, offer an opportunity for useful N recycling.

There are large differences between livestock species and production systems in how ingested N is partitioned between excreta, milk, eggs, and tissue growth. This is illustrated in Figure 5 with examples of N flows in a dairy production system, a suckler beef production system, and a pig production system. These examples are based on typical European production systems, which are among the more N-efficient systems globally. There are considerable differences between production systems globally which are not reflected here [40]. Two important examples of systems not represented here are pastoral ruminant production and backyard pig and poultry production.

Despite the large variation between production systems, the examples in Figure 5 illustrate a couple of points that hold broadly [40,41]. One is that monogastric (pig and poultry) meat production is much more N efficient than ruminant (cattle, sheep, goat, buffalo, etc.) meat. Pigs and poultry are inherently more efficient in converting feed to tissue growth. Another point is that a dairy cattle herd is much more N efficient than a suckler cattle herd, considering the total output of meat and milk protein.

However, an important difference between ruminant and monogastric livestock that does not come across in this analysis is their different feed and land requirements. Ruminants can live exclusively on grass and other forages which monogastric livestock can only eat in limited quantities while their main source of feed is cereals, oilseeds, and other crops directly competing for human food [30,35,36,42,43].

N emissions from livestock excreta vary widely depending on species, management methods, and climate and soil conditions. In these examples, typical emissions for European production systems have been assumed, including losses from livestock housing, manure storage and application, and on pastures, but note that these emissions can be very substantially mitigated by optimizing management systems [44–46] (see Section 6).

Figure 5: Illustrative examples of livestock feed nitrogen (N) conversion to meat, milk, manure, and by-products, based on European production systems. The diagrams show how one unit of feed N is partitioned on average in the whole livestock herd including animals of different age. In general, monogastric livestock such as pigs and poultry are more efficient than ruminants in converting feed N to meat. Note that efficiencies can vary considerably depending on breeds, feed composition, production intensity,

Figure 5: Illustrative examples of livestock feed nitrogen (N) conversion to meat, milk, manure, and by-products, based on European production systems. The diagrams show how one unit of feed N is partitioned on average in the whole livestock herd including animals of different age. In general, monogastric livestock such as pigs and poultry are more efficient than ruminants in converting feed N to meat. Note that efficiencies can vary considerably depending on breeds, feed composition, production intensity, and other factors. Apart from gaseous losses of ammonia (NH3) and dinitrogen (N2), there may be additional losses of N through nitrate (NO3) leaching from manure storage. See supplementary material for detailed background information: https://tabledebates.org/building-blocks/nitrogen-food-system


Box 3: Nitrogen compared to phosphorus

Phosphorus (P), like nitrogen (N) is an essential nutrient for all life forms and is also growth-limiting in many agricultural and natural ecosystems. Therefore, P to some extent plays the same dual role as N, as a key factor for agricultural productivity and as an environmental pollutant. There are, however, several important differences between N and P.

P is a limited resource, in contrast to N which is available in practically unlimited quantity as atmospheric dinitrogen (N2). P fertilizer is produced from mined phosphate minerals. The economically viable reserves of P are large, but on the time scale of hundreds of years, depletion of P is nevertheless an issue [47,48]. More immediate concerns over P supply are rather geopolitical, as reserves and production are concentrated in a handful of countries. In 2022, about 80% of global production came from six countries (China, Morocco, United States, Russia, Jordan, and Saudi Arabia) [49].

The main environmental impact of P is aquatic eutrophication, i.e., over-enrichment with nutrient, causing ecosystem change. The eutrophication of P affects freshwater ecosystems relatively more than N, which primarily affects marine water.

N is much more mobile and reactive than P. Therefore, N losses to the environment are more difficult to control. On the other hand, mitigation of N losses has a more immediate effect; P is mainly lost from soils through surface runoff and subsurface leaching, and these losses can continue for decades even when no new P is added. While losses of P to the atmosphere do occur in the form of dust transported by wind, these emissions are very small compared to atmospheric emissions of N.

P tends to accumulate in soils. It is clear that major soil P accumulation can persist for decades [50–52]. In the EU, it has been suggested that almost five times more P is currently accumulating in soils than is emitted to water bodies [53]; and research in Sweden shows that agricultural soils have accumulated about 700 kg P/ha over 50 years (about 14 kg P/ha/year), corresponding to about 50–100% of the soil P balance in the same period [54].

  1. The food protein supply shown in Figure 3 and Figure 4 is the supply to consumers before consumer-level food waste, which includes both inedible parts such as peels and bones, and edible parts that are spoiled or otherwise wasted. Actual human protein intake is therefore a bit lower than this supply.
  2. When protein is stated in supply statistics, what is typically meant is actually crude protein. The term crude protein refers to the fact that some of the N content of foods is non-protein forms. Crude protein content is defined as total N content multiplied by a factor, usually 6.25, but sometimes replaced by so-called Jones factors specific to different food categories and supposedly more accurate [12]. Determination of total N content is easy to do in laboratories, using the Kjeldahl method, in contrast to true protein quantification which requires more complicated procedures. The protein quantities given in this text are those reported in the FAO Food Balance Sheets, and the corresponding N quantities are calculated using the conversion factor 6.25.

This section explores different nitrogen (N) sources in agriculture, considering their effects on cropping systems, productivity, soil health, and environmental impacts. It starts with a historical perspective on N supply and then goes into the specifics of synthetic N fertilizers, biological N fixation (BNF), and manure and other recycled N.

4.1 A historical perspective on nitrogen supply

Until ca. 1960, agriculture’s main source of new (non-recycled) N was BNF. Although scientists didn’t come
to understand the biological and chemical mechanisms of BNF until the 19th century, people have known the agronomic benefit of using crops such as peas, lentils, vetches, alfalfa, and clover in crop rotations for thousands of years [55–58]. These crops commonly fix about 30–300 kg N/ha/year of which typically 50–90% is harvested and the rest remains in crop residues and in the soil, depending on crop type, crop yield, and other factors [59,60]. In addition, there are small but steady additions of N to soils through non-symbiotic BNF, carried out by microbes that do not depend on symbiosis with plants. Non-symbiotic BNF rates in soils are not well known, but likely amount to some 5–20 kg N/ha/year [1,61]. As an example, a cropping system with 20% of the area under legumes, fixing 100 kg N/ha/year, and 10 kg N/ha/year of non-symbiotic fixation, can therefore have a rotation- average BNF input of about 30 kg N/ha/year. This can be compared to modern agricultural systems where annual additions of synthetic N fertilizer are often 100–200 kg N/ha/year.

In addition to BNF, some societies have managed to live for extended periods on agricultural land whose soil N stocks were gradually being depleted. This is possible because soils can store very large quantities of N and other nutrients in soil organic matter. If there is net mineralization of soil N, i.e., a breakdown of organic matter to easily plant-available inorganic N, this N becomes available for new plants to grow. Net mineralization certainly benefited early agriculture in the river valleys of the Tigris, Euphrates, Nile, Indus, and Yangtze rivers, where tillage stimulated mineralization of soil organic matter that had accumulated over long time [62]. A more recent example can be found in North America, where initial cultivation of the prairie mineralized enormous amounts of N, likely peaking in the late 1800s with annual net N mineralization not far behind the quantities of synthetic N fertilizer input to the same land today [63]. Living on soil N mineralization is similar to living on one’s bank savings [64]. As with a bank account, without any income (new N), the situation cannot go on forever, but depending on soil history, management, and production it can carry on for decades and up to a century or more.

Recycled N in livestock and human excreta was much more important in pre-industrial agriculture than today. Livestock in particular filled crucial roles in collecting, concentrating, and redistributing nutrients. Through grazing and manual harvesting from pastures and meadows, livestock systems can collect and concentrate nutrients from large pasture areas, producing nutrient-rich foods but also nutrient-rich manure which can be applied at the time and to the place where nutrients are most needed [65,66]. This nutrient redistribution becomes particularly interesting in combination with the symbiotic N fixation in forage legumes, such as alfalfa and clover: the symbiotically fixed N not only provides nutrition to livestock but indirectly to the whole cropping system when the recycled N in livestock manure is applied. The effective use of BNF from forage legumes was a major influence in enabling agricultural intensification in Europe and North America in the 18th and 19th centuries [57].

Organic agriculture today still relies on symbiotic N fixation from forage and grain legumes as the main source of new N, and on livestock manure as a key mode of N transfer from legumes to the whole crop rotation. Whether it is possible for the global population to survive today solely on BNF-based agriculture, with or without livestock as nutrient recyclers, is explored further in Section 7.1 below.

4.2 Synthetic nitrogen fertilizer

Industrial ammonia synthesis brought profound change because it practically eliminated N scarcity and removed the need for legumes-livestock-manure rotations. The enormous increase in productivity and the spatial segregation of crop and livestock production since the mid-1900s would simply not have been possible without synthetic N fertilizer.

Is synthetic N fertilizer harmful to the environment? Answering this question requires a systems perspective on several issues: the quantity and spatial distribution of N inputs, the chemical forms of N inputs, as well as the emissions involved in fertilizer production.

The largest environmental concern with synthetic N fertilizer is the intensity of production, and thereby N emissions, that it enables. In the long run, all the N that is lost throughout the agri-food system, whether in
the field, in livestock housing and manure storages, in food waste, or in wastewater plants, must be replaced by input of new reactive N from somewhere. Without the massive new input of reactive N that synthetic N fertilizers enable, the whole N circulation would have to slow down, reducing agriculture’s pollution intensity, but also its productivity.

Relatedly, synthetic fertilizers have also led to increased spatial segregation of crops and livestock, resulting in further inefficiencies. As synthetic fertilizers reduced the incentives for manure recirculation, livestock production became more concentrated in some regions, sometimes resulting in large manure surpluses [67–70]. Large N emissions from manure, in these cases, can thus be understood as a symptom of an imbalance made possible by synthetic fertilizer (see also Section 6.2).

Another concern is that if not managed well, large inputs of N fertilizer can cause heavy soil acidification, which is generally detrimental to soil health (see Section 4.5 below). The current scientific understanding is that soil health effects of N depend mainly on the quantities of N inputs, and only to a lesser degree on their chemical forms (e.g., organic or inorganic) [71,72]. The soil health effects of fertilizer are therefore not so much a question of the chemical properties of synthetic N fertilizer as such, but rather about the fertilization intensity that industrial N fixation enables.

Production of synthetic N fertilizers causes considerable greenhouse gas emissions, about 3% of total food- system emissions [73,74]. This is for two main reasons. The first is that industrial NH3 synthesis is energy intensive, accounting for about 2% of global primary energy use, mostly in the form of fossil fuels [73]. The second is that some nitrous oxide (N2O) is emitted from production of nitrate-containing fertilizer such as ammonium nitrate [73,75]. In principle, at least 80% of these emissions can be eliminated by switching to renewable energy sources (so-called ‘green’ fertilizer production) and by mitigating the N2O emissions [72,73]. Note, however, that this switch will not help in reducing the majority of the food system’s N2O emissions; these arise from soils and downstream environments after application of fertilizers (synthetic and manure) and today account for about 8% of food-system greenhouse gas emissions. Read more about the climate impact of agricultural N in Section 5.

In summary, the introduction of synthetic N fertilizer triggered nothing less than a revolution for the global food system. Without it, current global consumption, in particular the unprecedented consumption of N-intensive animal-source food, would not be possible. Dietary change, especially in the most affluent countries, is a key opportunity to reduce reliance on synthetic N fertilizers and environmental impacts. This is further discussed in Sections 6 and 7.

4.3 Biological nitrogen fixation

As a source of new N input, BNF has some interesting properties compared to industrially fixed N:

  • Symbiotically fixed N is efficiently used by the plant since N fixation happens in the plant roots and is inherently synchronous with plant growth. Higher N use efficiency implies that less N is wasted through leaching and denitrification.
  • N input through symbiotic N fixation causes much lower emissions of N2O, compared to an equivalent quantity of synthetic N fertilizer [76].
  • BNF is ‘free’ in the limited sense that it happens without any direct economic cost to the farmer. The cost of BNF is rather the agricultural land used for the N-fixing crops. In contrast, synthetic N fertilizer is subject to unpredictable price fluctuations, and sometimes also to severe supply limitations in the case of conflict and other crises.

Based on these properties, BNF might look like a better way to supply new N than synthetic N fertilizers. But making such a comparison requires a holistic view of the whole food system, wherein legumes are considered both as food or feed sources and as net N sources for the whole cropping system [76–79]. The most obvious example of a legume-based system would be organic production with ruminants, in which forage legumes are key feed resources and also indirectly supply the whole crop rotation with N. Other BNF-based systems independent of livestock involving legumes as green manure and/or for biogas production are also possible.

Whether BNF is a better way to supply N therefore depends on a number of other factors, including what the desired crop and livestock outputs of the system are, what soil and climate the production is in, what level of productivity is needed, and what methods are used to recycle the biologically fixed N.

4.4 Manure and other recycled nitrogen sources

It is sometimes noted as a benefit of synthetic N fertilizers that because of their inorganic (and thus easily plant- available) form and their high concentration, they can more easily be transported and applied at the ‘right’ time and place, i.e., synchronous with crop growth. By contrast, organic N in manure becomes available as inorganic N gradually through decomposition, potentially causing a lack of synchrony between crop N supply and demand; and therefore a risk for higher N losses.

However, such a comparison of manure to synthetic fertilizers overlooks their different roles in the N cycle: synthetic N is a source of new reactive N whereas manure N is recycled and a necessary by-product of livestock production. The manure is there and should be used as efficiently as possible; but recycled manure N is fundamentally not an alternative to new N addition through synthetic N or BNF. Some new N will always be needed in some quantity to replace the N removed in food products and lost to the environment.

Another important property of manure and other organic amendments is that they have an effect on soil organic matter and thus on soil health and soil carbon stocks. Long-term experiments broadly show that manure and compost have strong positive effects on soil organic matter and thereby on soil structure, water retention, and crop yields [80,81]. But here too, it must be noted that recycled fertilizers such as manure and compost are roughly speaking a zero-sum game: manure and composts are limited in quantity and therefore applying them on one field means they cannot be applied on another. The question is therefore not manure or synthetic fertilizer, but rather where and how to make best use of the limited manure and compost resources, which are ultimately limited by input of new N from synthetic fertilizers or BNF.

4.5 Nitrogen inputs and soil health

Soil health is a loosely defined term to denote the physical, chemical, and biological properties of soil and their adequacy for plant growth and other soil life [82]. Given the complex role of N in soil chemistry and biology, it is highly relevant to ask, how do quantities and different forms of N input affect soil health? The short answer is: in multiple ways, positive and negative, that are not fully understood.

One well-known effect of N inputs is that they can accelerate the natural process of soil acidification. Soil acidification affects many biological and chemical processes and thus has various effects on plant growth and soil microbes. In practice, acidification of agricultural soil mostly has a negative effect on plant growth (except in naturally chalky soils) and therefore the advice is generally to minimize acidification and if needed apply lime to stop or reverse it [83]. Nitrification of NH3 and NH4+ from any source, including urea fertilizer and manure, (see Box 1) produces H+ ions (acid). If plants take up the nitrified N (NO3), they also take up H+ and there is no net acidification; but if NO3 leaches from the soil, the H+ ions remain in the soil and the net effect is soil acidification. By the same logic, plant uptake of NO3 fertilizer reverses acidification. The addition and plant uptake of ammonium nitrate (NH4NO3) therefore lead to net zero acidification, to the extent that both ammonium and nitrate is taken up by plants. By contrast, excessive N fertilization that causes N leaching also tends to cause soil acidification. The chemical process of BNF also produces H+ ions and legume cultivation is therefore also acidifying [83,84].

Another concern is with the potential soil health effects specific to N inputs in inorganic forms such as NH3, NH4+, and NO3, which the application of synthetic N fertilizers enables in large quantities. The evidence on this point is complex. Specific effects of inorganic N are difficult to study because many effects on soil health are mediated by soil acidification, also caused by the inorganic N inputs. Some results are available about inorganic N inputs, however. Very high concentrations of NH4+ can have direct toxic effects on soil microbes, and maybe on other soil life, but such concentrations are limited in time and space, and there is no strong evidence of long-term effects of such toxicity [71]. On a longer time scale, it is clear that soil nutrient supply changes the composition and functions of soil microbial life, although the effects seem to vary depending on environmental conditions [71]. For example, it seems, unsurprisingly, that nitrifying microbes (see Box 1) are more active when there is more chemically reduced N to be nitrified [71]. In summary, it cannot be said that inorganic N fertilizer is generally bad for soil health, but it is clear that heavily N fertilized soil is different in its soil microbial life.

Nitrogen (N) in its various forms contributes to a range of environmental and health impacts, including eutrophication, acidification, biodiversity loss, toxic air and groundwater pollution, stratospheric ozone depletion, and both warming and cooling contributions to climate change. The largest losses of N from the agri-food system are in the form of ammonia (NH3), nitrate (NO3−) and dinitrogen (N2) (not necessarily in that order). Emissions of nitrous oxide (N2O) and nitrogen oxides (NO×) are quantitatively much smaller, but they are still significant. Especially N2O is important as it is a very potent greenhouse gas. NO× is also an important environmental pollutant, but agriculture contributes only a small share of total emissions. Table 1 summarizes the main emissions and their impacts.

Table 1: Sources, quantities, and impacts of agricultural nitrogen (N) emissions. Approximate agricultural emission quantities are given in million metric tonnes N (Mt N) per year.

Nitrogen (N) compound Mechanisms of emission Global agricultural emissions Mt N/year) Environmental and health impacts
Ammonia (NH3)

Ammoniacal N (NH3 in equilibrium with the ammonium ion NH4+) is found in fertilizers and decomposing organic matter, in particular livestock excreta. NH3 escapes in gas form to the atmosphere. Emissions increase with temperature and ventilation [44–46]

Emissions come mainly from manure handling and storage, and application of manure and synthetic fertilizers.

30-509

Atmospheric NH3 can react with other air pollutants to form microscopic particles (PM2.5), for example ammonium sulphate [(NH4)2SO4] or ammonium nitrate (NH4NO3), causing respiratory diseases and cancer [88,89].

NH3 and N-containing particulate matter is eventually deposited on the ground or in water, contributing to eutrophication and acidification. This leads to changed ecosystem functioning, often including biodiversity loss.

Terrestrial eutrophication due to N deposition can lead to increased plant growth and carbon storage in plant biomass and soils, thus potentially contributing to climate change.

Nitrate (NO3) and dissolved organic N (DON)

Leaching and runoff from agricultural soils: NO3 and some organic N forms dissolve in water in soils and are washed out with precipitation. NO3, a negative ion, is repelled by the mainly negatively charged soil particles and is therefore highly mobile in soil.

Leaching rates depend strongly on soil NO3 concentrations, and also on texture (sandy soils leach more) and precipitation (more rain means more leaching and runoff).

40–6010

N causes eutrophication and ecosystem change in aquatic ecosystems where N is often a growth-limiting nutrient. Marine waters are typically more N limited than freshwater, but there is a large variation [90–92]. Eutrophication causes changed species composition and increased growth of plants and algae. Negative effects include harmful algal blooms which are toxic to humans and other organisms, oxygen depletion which impacts fish stocks and other aquatic life, and broadly biodiversity loss due to ecosystem change [93].

Growth and oxygen depletion in aquatic ecosystems can cause additional production of methane and N2O in aquatic ecosystems, causing a warming contribution to climate change [94–96].

NO3 intake has both negative and positive health effects [97–100]. Generally, the biggest source of NO3 intake is vegetables [97,98]. There is a WHO recommendation of maximum 50 mg NO3/l in drinking water, based on rare occurrences of an acute toxic effect (methemoglobinemia
or ‘blue-baby syndrome’) primarily known to have affected bottle-fed infants in combination with simultaneous gastrointestinal infection [97]. Another main concern is that NO3 is a precursor to carcinogenic N-nitroso compounds [97,99]; and research has detected increased colorectal
cancer risk associated with nitrate in drinking water down to ca. 4 mg NO3/l [99,101]. Positive effects include lower blood pressure, increased exercise performance, and prevention of type 2 diabetes [99,100]. Drinking water standards in many countries are equal or close to the WHO recommendation of 50 mg NO3/l, and concentrations are typically well below that limit. For comparison, EFSA sets the limit for safe intake at 3.7 mg NO3/kg body weight/day [102] or about 260 mg/day for a 70 kg adult.

Nitrous oxide (N2O)

N2O in agriculture is mainly formed in soils and manure storage through microbially mediated denitrification and nitrification (see Box 1). Emission peaks are observed after fertilizer application, but occur throughout the year in soils.

Some N2O is emitted from production of nitrate-containing fertilizer such as ammonium nitrate. These emissions can be effectively mitigated [75].

3–611

(4–8 including indirect emissions)

N2O is a strong greenhouse gas (273 kg CO2e/kg N2O in the GWP100 metric [106]). N2O has been estimated to account for about one-third of ‘farm- gate’ greenhouse gas emissions [107] and 10–15% of global food-system emissions [74,107]. However, see Section 5.3 for details on the total climate effect of agricultural N emissions.

N2O also contributes to stratospheric ozone depletion. Since the successful phase-out of CFCs, N2O is now the single most important ozone-depleting emission [108].

Nitric oxide (NO) and nitrogen dioxide (NO2), collectively nitrogen oxides (NO×)

Of global emissions around 40 Mt N/year, ca. 60% is from fossil fuel combustion, 15% from biomass burning (mainly in tropical savanna and woodlands), and 25% from microbial processes in soil [109].

Agricultural emissions are here calculated as including about 4% of fossil fuel combustion (including for fertilizer production) [110,111], 25–50% of soil emissions [109], and 4% of biomass burning [109].

4-6

NO×, through various chemical reactions, contributes to formation of smog, i.e., a toxic mixture of ozone, hydrocarbons, microscopic particles (PM2.5), and other substances. NO×is a major contributor to toxic air pollution causing cancer and respiratory disease (see also NH3 entry above) [89].

Similar to NH3, NO×and derived N-containing particulate matter is eventually deposited on the ground or in water, contributing to eutrophication and acidification (see also NH3 entry above).

Dinitrogen (N2) Denitrification, along with N2O (see Box 1). 30–8012 (not including indirect emissions) N2 emissions cause no direct harm. The atmosphere is about 78% N2.

5.1 The nitrogen cascade

Many things can happen to a N compound after it is released into the environment. For example, an NH3 molecule from agriculture might travel with the wind tens of kilometres, then be deposited in a natural ecosystem and assimilated into a soil microbe or plant, contributing to growth and ecosystem change. Eventually the microbe or plant dies and its organic N is decomposed to NH3 again. It might then be oxidized by another soil microbe to NO3 and leached to a nearby river with the next rain. In the river, the NO3 might be microbially denitrified to N2O gas persisting in the atmosphere for an average of about 100 years before suddenly being photochemically converted to unreactive N2.

The idea that reactive N, once emitted to the environment, can cycle through many forms and places, causing various effects on the way, is neatly summarized by the term N cascade [113]. Figure 6 illustrates the N cascade from the agri-food system perspective, focusing on the main environmental and health impacts of agricultural N emissions.

Figure 6: Illustration of the main environmental and health impacts of nitrogen (N) emissions from the agri-food system N. Unreactive dinitrogen (N2) from the atmosphere is converted to reactive N by industrial and biological fixation. Throughout the food system, emissions of ammonia (NH3), nitrate (NO3−), and nitrous oxide (N2O) affect the environment and human health in different ways.

Figure 6: Illustration of the main environmental and health impacts of nitrogen (N) emissions from the agri-food system N. Unreactive dinitrogen (N2) from the atmosphere is converted to reactive N by industrial and biological fixation. Throughout the food system, emissions of ammonia (NH3), nitrate (NO3), and nitrous oxide (N2O) affect the environment and human health
in different ways. A single N atom can have multiple impacts as it is transported and transformed in the environment. Brown arrows represent intentional N flows for food supply, while black arrows represent N waste and emissions to the environment. Illustrator: Susanne Flodin.

5.2 Local and variable impacts

Impacts occur both near and far from the emission source. NH3, for example, is typically deposited within some tens of kilometres, unless transformed to secondary particles such as ammonium sulphate [(NH3)2SO4] which
may travel hundreds of kilometres in the atmosphere [88,114–116]. Leached NO3 can accumulate in groundwater immediately underneath the field, or flow hundreds of kilometres towards the ocean [29,117–119]. In contrast, N2O, with an average atmospheric lifetime of more than a century, mixes globally in the atmosphere. Eutrophication, acidification, and toxic air and water pollution are all localized impacts, whereas the climate and stratospheric ozone depletion impacts are globally shared.

The impacts per unit N emission vary strongly depending on time and place. Ecosystems have intrinsically different sensitivity to N inputs, and the human health impacts depend on population density and exposure:

  • Environments have different species composition, with for example mosses and lichens particularly sensitive to NH3 [88,120].
  • Environments biochemically process N at different rates, depending on, e.g., climate, soil types, and populations of organisms. An important example is that environments have different denitrification rates, determining N concentrations in soils, groundwater, and surface water [21,112,121,122].
  • Different aquatic environments have different balances between N and other nutrients such as phosphorus (P) and silicon (Si), strongly affecting the eutrophication effect of additional N [117,123,90,124]. Broadly speaking, eutrophication of marine waters is caused by N pollution as they are more N-limited and eutrophication of freshwaters is caused by pollution with P as they are more P-limited [90–92,124].
  • The different flows of water in aquatic environments lead to different water turnover times, which thereby affects N concentrations and eutrophication effects. Typical examples of coastal waters with high N loads and slow water exchange, resulting in severe eutrophication, include the Baltic Sea, the Chesapeake Bay, Mar Menor, and the Yangtze river estuary.
  • Air and water pollution in highly populated areas lead to exposure for more people [89,101,115,125–127]. 

5.3 Total climate effect of agricultural nitrogen emissions

Agricultural N emissions have both warming and cooling effects on the climate, and the net effect on climate change is not well known.

The main warming contribution is via agricultural N2O emissions (see Table 1) of about 1.1–2.6 gigatonnes (Gt) of carbon dioxide equivalents (CO2e) per year13, i.e., about 6–14% of total emissions from the global food system around 18 Gt CO2e/year [74]. In addition, so-called indirect N2O emissions result as other agricultural N emissions such as NH3 and NO3 cycle through the N cascade [103]. These indirect N2O emissions likely add about 0.4–0.9 Gt CO2e/year.

The main long-term cooling contribution is the fertilizing effect of N in the environment, causing increased growth and C storage in vegetation and soils. In forests, it has been estimated on the basis of experiments and observational studies that total N deposition, including non-agricultural N sources, leads to net sequestration of perhaps 0.15–1.0 Gt CO2/year [95,128–132]. The large uncertainty has to do with multiple complexities, including nonlinear response of microbial decomposition and plant growth, and varying N limitation between boreal, temperate, and tropical forests [128–132]. In the oceans, N deposition causes carbon (C) sequestration of perhaps 0.5–1.1 Gt CO2/year [28,133,134]. However, not all of the forest and ocean C sequestration is due to agricultural N emissions: of the 80% of deposition that is anthropogenic, roughly half comes from agriculture, with the remainder, mostly NO×, from traffic and industry [135].

There are several additional factors that complicate the estimation of the total climate effect: N emissions can lead to both increased and decreased emissions of methane (CH4) through various mechanisms; NH3 as an aerosol has a direct cooling effect on the climate, an effect which in contrast to long-lived greenhouse gases such as CO2 and N2O does not accumulate over time; and in general there is much spatial variation in effects of N addition on ecosystems which as yet is only partly understood [95].

In summary, the net climate effect of agricultural N emissions is not well known [86,136]. Specific mitigation of agricultural N2O emissions will however clearly reduce warming. Mitigation of other emissions (mainly NH3 and NO3) can make both warming and cooling contributions, depending on where emissions occur.

5.4 How much nitrogen pollution is too much?

There is broad scientific and political consensus globally that N emissions need to be reduced very substantially to keep environmental and health impacts within acceptable limits. But it is difficult for several reasons to agree on precisely how much.

One issue in setting a global limit for N emissions is that impacts are multiple and localized: impacts depend on where, when, and in what chemical form N is emitted. Therefore, any global limit, such as the one derived for N pollution in the ‘planetary boundaries’ framework [137–139] must be an aggregation of local results, considering the variation in the movement of N in the environment, protected and sensitive environments, human population density and pollution exposure, and so on [86,140]. Then, to reach acceptable levels of impacts everywhere, emissions need to be controlled locally. While at the global level emissions need to decrease, some regions might be able to carry on as present, or even increase emissions of one or more forms of N.

Another issue in setting limits, whether local or global, is that there is no objective answer to what are ‘acceptable’ environmental and health impacts. Any such limit is inherently a value judgement. N pollution gives rise mainly to gradual environmental degradation and human health impacts [141]. Although there are important examples of so-called tipping points related to eutrophication, whereby local ecosystems suddenly and irreversibly shift into a contrasting state [142], the large body of evidence behind the N planetary boundary, water and air policy, etc., is predominantly about environmental and health impacts that gradually increase along with exposure [86,143–145]. Therefore, target-setting ultimately is mainly a question of managing gradual trade- offs between agricultural production and negative side effects [86,140,141,146–149].

Notwithstanding debates about the planetary boundary framing for N, it is very clear that the N problem is truly global in scale, both in the sense that some impacts are global or are transmitted over hundreds or thousands of kilometres, and in the sense that food systems are globally interconnected by international trade.

On the global level, there is broad consensus that N emissions need to be reduced greatly, perhaps by around 50%. A large body of research suggests that reaching environmental quality aims everywhere, based on estimates of environmentally acceptable N concentrations and loads in different ecosystems and in groundwater, requires a roughly 50% reduction of global agricultural N emissions [86,139,140].

From an economic cost-benefit perspective, it has been estimated that the societal costs of agricultural N emissions in Europe, measured as willingness-to-pay for avoided impacts, substantially exceed the economic benefits of N in the agricultural sector [127]; and globally it has been estimated that a N emission reduction of 32% can be achieved (see Section 6 for an overview of how), without dietary change, with societal benefits outweighing costs by a factor of 25 [136]. This economic perspective is one way of saying that current emissions are clearly ‘too much’ in the sense that societal benefits of properly targeted mitigation would be much greater than the costs.

Two prominent examples of high-level political agreements in this direction are the Farm to Fork policy (2020) of the European Union, which says that ‘[t]he Commission will act to reduce nutrient losses by at least 50%, while ensuring that there is no deterioration in soil fertility’ [150]; and Target 7 of the Kunming-Montreal agreement (2022) of the Convention on Biological Diversity, which sets the aim by 2030 ‘reducing excess nutrients lost to the environment by at least half, including through more efficient nutrient cycling and use’ [151].

  1. See Refs. [85–87]
  2. See Refs. [27,33,86]
  3. Direct agricultural N2O emissions are likely 2.5–6 Mt N/year [73,103,104]. Indirect emissions of N2O are those that occur in the environment due to agricultural emissions of, e.g., NH3 and NO3 [103]; these amount to about 1–2 Mt N/year [73,103,104]. Similarly, Crutzen and colleagues [105] estimated in 2008 that, through the N cascade, about 3–5% of anthropogenic N fixation (synthetic N fertilizers and BNF) is eventually converted to N2O (i.e., direct and indirect emissions). With a total agricultural fixation of ca. 150–170 Mt N/year, this means ca. 5–9 Mt N2O-N/year.
  4. Agricultural denitrification rates are subject to very large uncertainties. Terrestrial denitrification (N2 and N2O) is constrained to about 90–200 Mt N/year, of which a poorly known share is in agricultural soils and manure management [21,44,112]. Variation in soil denitrification is enormous depending on soil texture and climate.
  5. Direct agricultural N2O emissions amount to about 2.5-6 Mt N/year [73,103,104] or 3.9–9.4 Mt N2O/year. Using the GWP100 factor 273 kg CO2e/kg N2O, this translates to about 1.1–2.6 gigatonnes CO2e/year. Indirect N2O emissions of ca. 1–2 Mt N/year add about 0.4–0.9 Gt CO2e/year.

This section is about how the environmental and health impacts of nitrogen (N) from agri-food systems can be mitigated. It outlines three approaches for mitigating the impacts of agricultural nitrogen (N) use: (1) increasing N use efficiency, (2) spatially redistributing N inputs and agricultural production, (3) and changing human diets.

6.1 Increase nitrogen use efficiency

N use efficiency is defined as the ratio of N in outputs (e.g., meat, milk, or crop harvest) to N in inputs (e.g., feed or fertilizer). For a given amount of outputs, increasing N use efficiency means that the amount going to waste is reduced, as is the need to add new reactive N.

The main principle to keep in mind, before diving into specific efficiency increases, is that a systems perspective is necessary to avoid pollution swapping. For example, if NH3 losses from manure management are reduced, then more manure N is available for application in crops. Unless other crop N inputs are reduced, the increased input of manure N will likely lead to increased leaching or denitrification losses in the field. In general, the idea is that increased efficiency in any part of the system must be matched by increased system-wide production and/ or reduced N input. Otherwise, N losses are merely shifted to another time and place [4,46,136]. Metaphorically, this can be compared to a leaky pipe: emissions depend on the flow through the pipe and the size of holes in the pipe, and the risk is that closing one hole in the pipe causes an increased leak through another [152,153].

Efficiency improvements can be conceptually divided into two categories: (1) increasing conversion efficiency, and (2) increasing circularity. Examples of increasing conversion efficiency are to increase fertilizer N uptake in crops, increase feed use efficiency in livestock, and minimize waste in food and feed processing. Examples of increasing circularity are to increase the use of food waste as livestock feed, and to produce fertilizers from food and feed waste or human excreta. When zooming out to the whole agri-food system, both these categories of improvements ideally lead to reduced waste and a reduced need to input new reactive N whether from synthetic fertilizers or BNF.

On the level of the whole food system, shifting diets to more plant-based food is a major opportunity for increased efficiency. This is discussed separately in Section 6.3 below.

The remainder of this subsection outlines several key principles and technologies for efficiency improvements in the agri-food system.

Crops make optimal use of N inputs when they are healthy and undisturbed by competition and other resource constraints. A large number of approaches and techniques can be combined to ensure healthy and productive crops. Co-limitation of water and other nutrients can be avoided using irrigation, suitable tillage methods, and balanced fertilization [154,155]. Crop diseases, pests, and weeds can be suppressed using a variety of methods, each with their pros and cons: adoption of good crop rotations, promotion of natural enemies, tillage, weeding, and the application of pesticides [81,156,157].

Similarly, livestock are most productive when they are healthy and free from excessive heat, cold, and other stresses. Among many factors, nutritionally balanced feed is one key to livestock health and productivity [45,46]. Also, as mentioned in Section 3, efficiency gains in animal production systems have been reached through breeding and feed formulations that promote faster growth and shorter lives of animals, which leads to a smaller share of feed used for metabolic maintenance. It is important to note, however, that this approach can impact negatively on animal welfare.

Moving onto soils, leaching and denitrification losses from agricultural land can be mitigated in many ways [46,136]. Since both nitrate (NO3) leaching and denitrification are promoted by high NO3 concentrations and water flows (see Box 1), the most important mitigation measures build on ensuring low NO3 concentrations when crop demand is low and precipitation high. This is done, first and foremost, by applying N fertilizer in quantities and with timing adjusted to how much the crop can assimilate. Such approaches are often discussed under the heading ‘precision fertilization’ and the ‘4R’ approach (fertilizer application from the right source, at the right rate, right time, and right place). Another important technique is to ensure that something is growing on fields during rainy seasons, thereby keeping soil NO3 concentrations low. Perennial grasses on cropland and in permanent meadows and pastures generally have low leaching losses. In annual crop production, one common option in temperate climate is to grow winter-sown crops (e.g., winter wheat) or alternatively cover crops that grow during winter to absorb N that might otherwise be leached. These cover crops can then be used as feed or green manure, for example. Other approaches include the use of chemicals known as nitrification inhibitors, which slow the microbial conversion of ammoniacal N to NO3 and thereby can reduce losses through leaching and denitrification [158].

Losses of NH mainly occur in manure management and in connection to application of manure and synthetic fertilizers. There are several approaches to mitigate these losses [44–46]. NH3 emissions are driven by the chemical equilibrium between water-dissolved ammoniacal N ⇌ ammonia gas. Losses increase with increasing ammoniacal N concentrations, substrate pH, temperature, and wind speed. Therefore, key technologies build on reducing air contact time and wind speed, lowering temperature, lowering pH, and lowering ammoniacal N concentrations. For example, technologies include: covering manure storages; lowering temperature and ventilation of animal houses and manure storage; acidifying manure (lowering pH) in storage or at application using, e.g., sulphuric acid14; incorporating fertilizers into soil to reduce air contact; spreading manure on cool days if possible, ideally with a light rain to infiltrate N in soil; using chemicals known as urease inhibitors, which slow the microbial decomposition of urea to ammonium; and capturing NH3 from animal houses and manure storage using air scrubbers and other technologies. Since several of these mitigation technologies are relatively easy to standardize and evaluate, researchers have been able to quantify the potentials and costs of these measures relatively well [44–46,136].

Reducing food waste appears in many analyses to offer a considerable opportunity to reduce N waste throughout the agri-food system. The precise quantities, and even more the mitigation potential, are however notoriously difficult to quantify. It is clear that many crop and livestock products intended for human consumption are not ultimately ingested by humans for numerous reasons including processing waste, disqualification by quality standards, and spoilage during storage. But reliable primary data on food loss and waste are scarce, and often inadequate in detail to make reliable estimates of how much loss and waste could actually be avoided [11,161–165]. The United Nations Environment Programme (UNEP) has estimated that about 17% of global consumer food supply in 2019 was wasted (counted as fresh weight); it notes, however that this figure includes both edible and inedible parts and that reliable estimates are lacking of the edible share that could theoretically be avoided [165].

When it comes to increasing N circularity, the largest unused potential is undoubtedly human excreta. Human N excreta globally equal about one-quarter to one-third of total synthetic N use, but this resource is currently almost entirely wasted (see Section 3.2). There are many possible methods for hygienic and safe recovery of nutrients from human excreta [38], but, unfortunately, reaching a high degree of recovery would require huge infrastructure investments to move away from the present model for ‘modern’ waste treatment, which is based on wastewater systems and maximizing N2 denitrification in wastewater treatment plants [37–39]. Sewage and wastewater treatment systems are an enormous technical lock-in.

Food waste recycling is another opportunity for increased N circularity. As mentioned above, food waste quantities are difficult to estimate, and it is even more difficult to say what percentage of food loss and waste is already recycled as, e.g., livestock feed, or fertilizer through biogas or composting systems.

Moreover, some waste of livestock feed is inevitable in storage, processing, and in livestock housing. Feed waste in livestock houses in many cases ends up mixed into manure management systems, and so will have a similar recycling fate as manure N.

Inefficient recycling of livestock excreta is another issue that is difficult to quantify. Most livestock excreta are returned to agricultural land, either directly by grazing livestock on the land, or via storage and application of manure. A small share of livestock excreta (how much is highly uncertain but globally perhaps a few percent) is disposed of outside agriculture, e.g., used as fuel or discharged to the environment [40,166,167]. The largest inefficiency in manure recycling lies in the fact that some regions and farms have such high livestock concentrations that manure supply far exceeds crop nutrient demand [69]. Given the economic incentives to keep these high livestock concentrations, there is a growing interest in various technologies to produce concentrated N fertilizers from manure [168]. An alternative approach is to redistribute livestock to ensure that all manure can be efficiently used in crops; which brings us to the next point.

6.2 Change agriculture’s spatial distribution

Agriculture’s spatial distribution shapes environmental and health impacts in many ways. Broadly, there are two parts to this observation.

First, the spatial distribution of agricultural production determines its N use efficiency and emission intensity. A main reason for this is the diminishing marginal yield response to N inputs. Each additional unit of fertilizer has successively smaller effects on yields and thus causes successively higher N waste. Therefore, by spatially reallocating N inputs, perhaps between neighbouring farms, perhaps between continents, the overall crop yield will change depending on the different marginal yield responses [148]. A complicating factor is that yield response also depends on many other factors including soil types, climate, crop rotations, water limitation, and so on. There are also, of course, economic and legal constraints. In any case, research shows that the global distribution of agricultural production is far from optimal in terms of N use efficiency; or put another way: by prioritizing N input where it benefits crops the most, the same production could be achieved with far less N emitted to the environment [69,169–175]

Second, the spatial distribution of emissions determines their environmental and health impacts. A given amount of N pollution causes more harm in certain environments: particulate matter close to a population centre, atmospheric N deposition in a sensitive forest, or N leaching in a sensitive marine area, for example.

The spatial redistribution of agricultural production therefore affects both the quality and quantity of impacts. Research suggests that managing N inputs in light of these observations provides a major opportunity to maintain or even increase global food production while reducing environmental and health impacts [86,89,125,136,139,140].

In theory, this spatial redistribution idea holds an enormous potential to reduce damages to the environment and human health. But in practice, there is (luckily) no global central planner who is able to make such an optimization. Real-world implementation is mostly incremental and always imperfect, negotiated politically and economically through a patchwork of policies and market forces, and constrained by various practical factors. The theoretical explorations of this idea are nevertheless important, in order to map out the biophysical possibilities.

In practice, a large number of policies and market forces explicitly target the spatial structure of agriculture, although they are not always described as such, and they are not always implemented to the benefit of the environment. Examples of such policies and market forces include protected areas, subsidies and taxes, trade regulations, and agricultural intensity regulations. An important class of such policies are agricultural production subsidies, which shape production volumes and methods, unfortunately often in severely suboptimal ways from a societal viewpoint [176]. Another is market regulations, such as the former EU milk quota system, which had strong effects on intensity and spatial structure of milk production in the EU. A third class of examples are environmental policies, for example: policy support for organic agriculture (which has lower input and production intensity than conventional agriculture); the EU Nitrates Directive (1991), which requires member states to designate Nitrate Vulnerable Zones, where application of manure N is limited to maximum 170 kg N/hectare/ year [177]; and the EU Habitats Directive (1992) which is currently reshaping agriculture in the Netherlands after courts have ruled that the country is not doing enough to abate NH3 emissions considering biodiversity impacts [178].

6.3 Change human diets

In principle, a dietary shift away from the most N-intensive foods offers a huge potential to reduce the environmental impacts of food production. Per-capita supply of animal-source protein varies enormously between countries, from almost zero to over 80 g/capita/day (see Figure 7). Globally, animal-source food provides about 40% of dietary protein. For some populations where there are serious problems of hunger and micronutrient deficiency [179], these animal-source foods can play an important role in improving human nutrition. However, in affluent contexts where intake of animal-source food is currently very high but where people can also afford and access a wide range of plant-based foods, the nutritional importance of animal-source food is much smaller [179]. As a global average, humans consume well above their dietary needs of most nutrients [180]. To reduce N emissions and related impacts, the most effective change would be for these high consuming populations to reduce their consumption of animal-source food (meat, dairy, and eggs). This would strongly reduce the total need for feed production, manure management and application, and related N emissions [149,181–183]. 

Figure 7: Per-capita food protein supply and gross domestic product (GDP) in countries of the world. Each marker represents one country, with size proportional to population. The dashed lines are linear regressions. The shaded band shows a range of minimum safe protein intake, calculated from the WHO safe protein intake (0.83 g protein/kg body weight/day) and the global range of country-average body weights (50–82 kg/capita) [184,185]. Data from the FAOSTAT database.

Figure 7: Per-capita food protein supply and gross domestic product (GDP) in countries of the world. Each marker represents one country, with size proportional to population. The dashed lines are linear regressions. The shaded band shows a range of minimum safe protein intake, calculated from the WHO safe protein intake (0.83 g protein/kg body weight/day) and the global range of country-average body weights (50–82 kg/capita) [184,185]. Data from the FAOSTAT database.

6.4 Summary of approaches and potentials

Research shows that an ambitious and integrated package of measures to increase efficiency and optimize agriculture’s spatial distribution could reduce future food-system N losses by 30–50%, without dietary change, compared to business-as-usual scenarios [136,148,149,171,175,182,183,186,187]. There are however several major uncertainties in any such estimate; and it must be noted that these are merely estimates of technical possibilities, not predictions of likely implementation.

Human dietary change offers an additional and very large potential to reduce N losses. Different scenarios for future human diets vary enormously in terms of N losses. As a point of reference, present-day food protein supply (from both plant and animal sources) varies between countries from less than 60 g/person/day to about 120 g/person/day. Almost all of this variation is in animal-sourced proteins, which have relatively high N emission intensity. The most affluent countries are therefore responsible for per-capita N losses several times higher than the poorest countries [188,189].

While humans can survive on very frugal diets consisting mainly of cereals or starchy roots, as do the poorest people in the world, such a scenario for the future is of limited interest since it is both unlikely and highly undesirable (both nutritionally and culturally). Rather, most serious scenario analyses of dietary shifts start from a baseline projection based on likely growth in population and affluence, and then explore various changes from that starting point. Such research shows that adoption of healthy but less N-polluting diets might plausibly cut future food-system N losses by 10–40% compared to business-as-usual scenarios [77,148,149,181–183,186,187]. With a combination of production and consumption side measures it is therefore clearly possible to cut global N emissions by 50% or more.
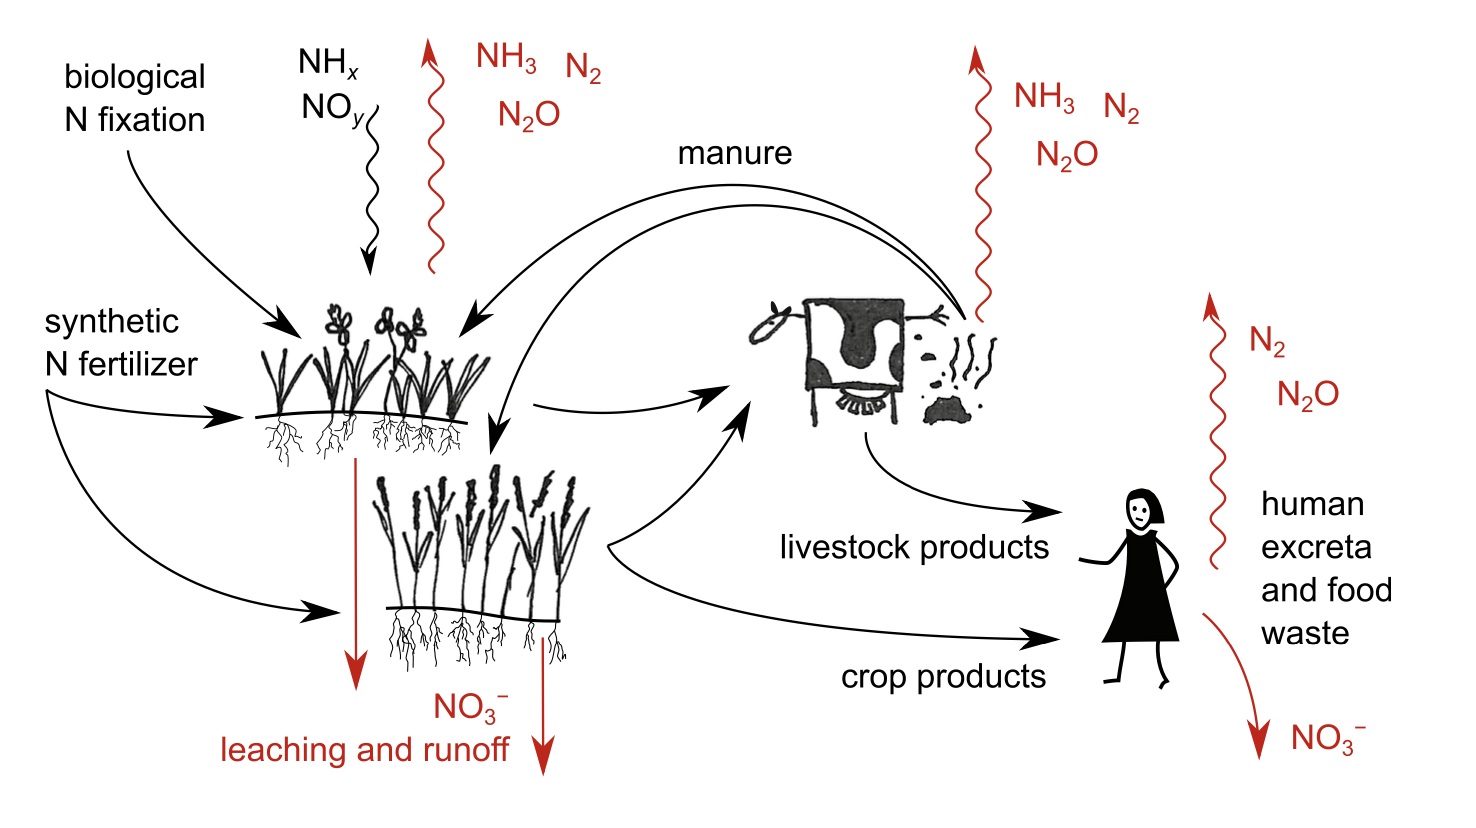
  1. Acidification of manure has multiple effects on the properties of manure, which are currently being researched [159]. A negative side effect of long-term addition of acid is unwanted soil acidification, which can then be counteracted by additional liming of soil [160]. There is also some evidence that acidification of slurry acts to slow or delay nitrification with implications for emissions of nitrous oxide (N2O) and nitrate (NO3) [159]. Given the many effects of soil pH on microbes, there are likely other effects on soil processes which may be uncovered by future research.

How can a sustainable food supply be guaranteed for a future world population projected to stabilize at around 10 billion? This is a big question. Fully answering it is arguably the major project of food systems research, involving interacting questions of biophysical, political, economic, and moral nature. Based on the previous sections, it is perhaps possible to draw some conclusions on some of the nitrogen-related aspects of this question.

First, it is important to emphasize that this text is about some biophysical aspects of global food supply, not about the much larger and more complicated question of how to ensure global food security or food sovereignty. Ending hunger and malnutrition will require not only production of sufficient food, but also societies with institutions and economic conditions that reliably enable access to sufficient, safe, affordable, and culturally acceptable food for all [190,191]. Increasing food production is no guarantee that hunger and malnutrition will decrease. For that, also distribution of wealth and power must be more equal. Hunger and malnutrition will sadly persist at least as long as leaders wilfully use hunger as a weapon or allow it as collateral damage in pursuit of other goals [191,192]. Read more in the TABLE Explainers on food security and food sovereignty [193,194].

7.1 Food for 10 billion without synthetic nitrogen fertilizer?

What would happen if the world decided to produce all food without synthetic N fertilizer? Could it be done? Would it be preferable?

The easiest way to study the possibility of a world without synthetic N fertilizer is to look at organic agriculture, which by definition prohibits synthetic N. The key consideration in terms of productivity and N emissions is that the intensity of organic agriculture (defined in terms of yield per unit area) is limited by N supply [77,182,195–197]. Per unit product, organic agriculture generates roughly equal to or slightly lower N emissions [77,81,157,195–198], but per unit area, organic agriculture has considerably lower productivity and N emissions [199,200]15. Although much could be done to increase productivity in organic agriculture [201], the fact remains that organic agriculture is fundamentally limited by N and therefore for the foreseeable future will remain less productive than conventional agriculture [77,196,197]. What this means is that a given human diet will cause roughly the same quantity of N emissions whether produced in organic or conventional agriculture, but the organic production system will use more land and have correspondingly lower N emissions per hectare. The lower N emissions per hectare (in addition to any other benefits of organic agriculture) are clearly an advantage for protecting the local environment, but the higher land use is a disadvantage that needs serious consideration.

Therefore, a global shift to organic agriculture would require major changes in human consumption, and/or expansion of agricultural land to make up for the lower crop yields. While the lower crop yields of organic agriculture present legitimate grounds for concern that tropical deforestation would accelerate [202,203], it’s not inevitable that this would happen since crop yields, human diets, and land use can theoretically be matched in many ways. What is inescapable, though, is that a global shift to organic agriculture would cause lower crop production per unit area, with implications for land use, human diets, or both [79,182].

Research shows that it would very likely be possible to supply a world population of 10 billion with sufficient food entirely without the use of synthetic N fertilizer and without agricultural land expansion, but it would require a global average diet with less meat and other N-intensive foods [77,78,182,196,197]. A reorientation along these lines would also lead to major reductions in environmental N emissions. But the thought experiment of eliminating synthetic N without changing human diets is frightening: it would almost certainly result in food shortage or accelerating deforestation, or both.

Would it be better to do without synthetic N? This question does not have any simple answer. The relative merits of synthetic N fertilizer and biological N fixation as sources of new N have to be evaluated in the full food system context, including human diets [76,77,79] (see also Section 4). If global average diets were to shift to considerably lower intake of meat and other N-intensive food, then a different food system would be possible, with much less input of new N required (whether industrially or biologically fixed) and much less N lost to the environment. Insofar as legumes are well integrated in the food system, biological N fixation is an excellent source of N, and it is possible that such a hypothetical low-N future would be best served by mostly biologically fixed N. That said, it seems likely that there would be at least some farming systems where synthetic N would be the better option. After all, adding a constraint (for example, using no synthetic N) to an optimization problem is to limit the space of solutions and therefore can never improve the best solution, regardless what one wants to achieve. It is possible to imagine a situation where diets shift very considerably away from N-intensive consumption and where legumes in crop rotations provide both a large share of new N input and other benefits (including pest and weed suppression and improved soil structure) [60,76], but where judicious use of synthetic N fertilizer is allowed to ‘top up’ N supply in certain crops and situations. Such a scenario, compared to an all-organic one, would give rise to similar levels of N emissions but require less agricultural land.

Simply put, dietary change, allowing lower intensity production and much lower N emissions, is a major possibility for change. The optimal combination of synthetic N and biologically fixed N, then, depends on the exact composition of human diets and how legumes can be integrated in farming systems.

7.2 What would be needed to reach politically agreed targets?

As described in Section 5.4, cutting agricultural N losses by about 50% is a number that many politicians and researchers can agree on. Examples of high-level policy documents specifically naming 50% include the EU Farm to Fork policy (2020) and the Kunming-Montreal agreement (2022) of the Convention on Biological Diversity.

Despite these high political ambitions, actual progress is mixed, and with few exceptions is much too slow to reach stated targets by 2030. If the world is actually to reach the –50% goal, then rapid action is needed to compensate for the current severe lack of specific policies to match the high-level targets.

What would be needed, concretely? The short answer is, almost everything that can be done. A large body of research shows that there is no silver bullet [148,149,175,181–183,186,187]. Even combining all the efficiency improvements imaginable, it is very unlikely that agreed environmental goals can be reached without dietary change (see Section 6.4).

The necessity of dietary change, in addition to efficiency improvements, is also a common conclusion drawn by research into other environmental and health targets regarding land use change and habitat loss, freshwater depletion, toxic pollution, and climate change [139,149,183]. A clear example from climate change research is that continued production of foods to provide for present-day global diets alone, even with all imaginable efficiency improvements, would likely cause additional global warming of about 0.6°C by the end of the century, making it nearly impossible to keep global warming under 2°C [204].

7.3 Food production, nitrogen pollution, land use: inevitable trade-offs

In summary, current human consumption (and associated production) trajectories are incompatible with agreed environmental targets. This leads to difficult and mostly unresolved questions about the future of human food consumption. Global human diets are not under absolute political control, and hopefully never will be; nevertheless, many small and large political decisions indirectly influence what people consume today and in the future. History shows a remarkable regularity in the relationship between economic growth and human dietary choice (see Figure 7); but these past trends are not without exception and are not laws of nature. A mix of economic, technical, and cultural factors can lead societies on very different dietary trajectories. For a deep dive in possible dietary futures, listen to TABLE’s podcast series Meat: The Four Futures and read the preceding 2015 TABLE paper on the same topic [205].

It also leads to difficult questions about environmental targets. A society can choose to, and sometimes does, abandon its politically agreed targets if reaching them is considered impossible, too costly, or politically inconvenient. Climate change, habitat destruction, freshwater depletion, eutrophication, and air pollution are examples of areas where societies have in many cases decided, explicitly or implicitly, not to do what is stated in high-level policy documents.

When trying to make sense of these global trends and targets, it is important to remember that human decisions and also much of the environmental and health impacts are local in nature. Moreover, this is not an all-or-nothing game: very substantial progress towards sustainable N use in the food system can be made incrementally and even without global coordination. What lies ahead, therefore, is certainly a diverse and messy mix of small collisions and course corrections as the world continues to grapple with the food-environment dilemma.

  1. A reason that organic agriculture has lower emissions per unit product is that N use efficiency of crops diminishes with increasing intensity; so the lower intensity of organic agriculture leads to higher efficiency, all other things being equal. On the other hand, organic crops can be more severely affected by weeds and crop pests than conventional agriculture, where pesticides help to protect crops. Another difference in the N use efficiency of conventional and organic production systems is because high-intensity livestock production tends to have higher feed use efficiency (Section 6); this implies an advantage for the more intensive livestock rearing, which is often but not necessarily to be found in the conventional system.

In food systems, nitrogen (N) plays a dual role: it is essential for agricultural production, but it is also an environmental pollutant. During the last century, industrial ammonia synthesis has completely revolutionized agricultural production by practically eliminating N limitation in large parts of the world. This has massively boosted productivity and greatly increased per-capita food supply for a growing world population. The side effects however, including eutrophication, air and water pollution, greenhouse gas fluxes, and stratospheric ozone depletion, are having dangerously damaging consequences.

There is no such thing as a food system free of N pollution. Losses of N are inherent to the biophysical processes of the N cycle and they are impossible to fully control. What is clear, however, is that the introduction of synthetic N fertilizer made possible the acceleration of the N cycle, and the wasteful management of N, that today harms the environment and human health far more than necessary.

Much can be done to mitigate the environmental and health impacts of N pollution. The least controversial mitigation options are centred on improved technology and N management, and spatial optimization of agricultural production to increase efficiency and avoid harms to sensitive environments. These options hold a very considerable potential to mitigate impacts and can be undertaken at local and regional levels without the need for collective global coordination or agreement. Another very major, but more contested, option is a dietary shift, primarily in the most affluent countries, to reduced consumption of the most N-intensive foods, in particular of meat and other animal-source foods.

Research shows that no one option on its own will be sufficient. Specifically, recent research finds that production-oriented measures such as efficiency improvements, food waste reductions, and spatial optimisation will almost certainly be insufficient to reach agreed environmental targets. Alongside these measures it will also be necessary to shift global average food consumption onto a trajectory with less animal-source food. This can be realized by major cuts in consumption among high-income consumers even if the world’s poorest increase their consumption from currently very low levels.

Current policy implementation in many countries is much too slow to reach agreed environmental targets. There is an urgent need for concrete action on both production and consumption sides. The tools are all there: research results and practical experience provide a wide range of well-known and effective measures ready for implementation. The main concern now is whether policy-makers, industry, and society at large are ready to take the decisions necessary to match the agreed targets.

Suggested citation

Einarsson, R. (2024). Nitrogen in the food system. TABLE Explainer. TABLE, University of Oxford, Swedish University of Agricultural Sciences, and Wageningen University and Research. https://doi.org/10.56661/2fa45626

Written by

Rasmus Einarsson, Swedish University of Agricultural Sciences With input from Tara Garnett and the wider TABLE team

Illustrations

Figures 1, 2, 3, 5, and 7: Rasmus Einarsson Figure 4: Rasmus Einarsson and Luis Lassaletta Figure 6: Susanne Flodin

Reviewed by

Souhil Harchaoui, INRAE; Adrian Muller, FiBL; and Lena Schulte-Uebbing, PBL.

Acknowledgements

This publication is truly the result of a collaborative effort. First and foremost I wish to thank Tara Garnett for patient, detailed, and intellectually rigorous feedback on five previous versions of the manuscript. Thanks also to the three external reviewers, Souhil Harchaoui, Adrian Muller, and Lena Schulte- Uebbing, and to Ken Giller and TABLE staff Tamsin Blaxter, Hester van Hensbergen, and Sophie Hockley for detailed and constructive feedback at various stages. Thanks to Lise Benoist for comments on an earlier draft and Luis Lassaletta for helping to create Figure 4. Last but not least, thanks to Susanne Flodin, the illustrator who swiftly and happily collaborated with me to transform my terrible sketch to what became Figure 6. The end result would not have been nearly the same without all your contributions.

Cover

A leaf on the ground, photo by Sean Foster.

To read more from the Explainer series, visit:

www.tabledebates.org/explainers

  1. Smil, V. Nitrogen in crop production: An account of global flows. Glob. Biogeochem. Cycles 13, 647–662 (1999). https://doi.org/10.1029/1999GB900015
  2. Oenema, O. et al. Approaches and uncertainties in nutrient budgets: implications for nutrient management and environmental policies. Eur. J. Agron. 20, 3–16 (2003). https://doi.org/10.1016/S1161-0301(03)00067-4
  3. Schröder, J. J. et al. An evaluation of whole-farm nitrogen balances and related indices for efficient nitrogen use. Eur. J. Agron. 20, 33–44 (2003). https://doi.org/10.1016/S1161-0301(03)00070-4
  4. Schröder, J. Revisiting the agronomic benefits of manure: a correct assessment and exploitation of its fertilizer value spares the environment. Bioresour. Technol. 96, 253–261 (2005). https://doi.org/10.1016/j.biortech.2004.05.015
  5. Bodirsky, B. L. et al. N2O emissions from the global agricultural nitrogen cycle – current state and future scenarios. Biogeosciences 9, 4169–4197 (2012). https://doi.org/10.5194/bg-9-4169-2012
  6. Billen, G. et al. A biogeochemical view of the global agro-food system: Nitrogen flows associated with protein production, consumption and trade. Glob. Food Secur. 3, 209–219 (2014). https://doi.org/10.1016/j.gfs.2014.08.003
  7. Lassaletta, L. et al. Nitrogen use in the global food system: past trends and future trajectories of agronomic performance, pollution, trade, and dietary demand. Environ. Res. Lett. 11, 095007 (2016). https://doi.org/10.1088/1748-9326/11/9/095007
  8. Zhang, X. et al. Quantifying Nutrient Budgets for Sustainable Nutrient Management. Glob. Biogeochem. Cycles 34, e2018GB006060 (2020). https://doi.org/10.1029/2018GB006060
  9. Bach, M. et al. Reactive nitrogen flows in Germany 2010-2014 (DESTINO Report 2). (Umweltbundesamt, 2020).
  10. Klement, L. et al. Calculation of a food consumption nitrogen footprint for Germany. Environ. Res. Lett. 16, 075005 (2021). https://doi.org/10.1088/1748-9326/ac09ad
  11. Einarsson, R. et al. The nitrogen footprint of Swedish food consumption. Environ. Res. Lett. 17, (2022). https://doi.org/10.1088/1748-9326/ac9246
  12. Mariotti, F. et al. Converting Nitrogen into Protein—Beyond 6.25 and Jones’ Factors. Crit. Rev. Food Sci. Nutr. 48, 177–184 (2008). https://doi.org/10.1080/10408390701279749
  13. Einarsson, R. Assessing reactive nitrogen flows in European agricultural systems. (Chalmers University of Technology, 2017).
  14. Einarsson, R. Agricultural nutrient budgets in Europe: data, methods, and indicators. (Chalmers University of Technology, 2020). ISBN 978-91-7905-367-3.
  15. Ward, B. B. Nitrification. in Reference Module in Earth Systems and Environmental Sciences (Elsevier, 2013). ISBN 978-0-12-409548-9. https://doi.org/10.1016/B978-0-12-409548-9.00697-7
  16. Thamdrup, B. New Pathways and Processes in the Global Nitrogen Cycle. Annu. Rev. Ecol. Evol. Syst. 43, 407–428 (2012). https://doi.org/10.1146/annurev-ecolsys-102710-145048
  17. Jaffe, D. A. The Nitrogen Cycle. in Earth System Science vol. 72 322–342 (Academic Press, 2000). ISBN 0-12- 379370-X.
  18. Butterbach-Bahl, K. et al. Nitrogen processes in terrestrial ecosystems. in The European Nitrogen Assessment (Cambridge University Press, 2011). ISBN 978-1-107-00612-6.
  19. McNeill, A. et al. The Nitrogen Cycle in Terrestrial Ecosystems. in Nutrient Cycling in Terrestrial Ecosystems (eds. Marschner, D. P. et al.) 37–64 (Springer Berlin Heidelberg, 2007). ISBN 978-3-540-68026-0. https://doi.org/10.1007/978-3-540-68027-7_2
  20. Groffman, P. M. et al. The Nitrogen Cycle. in Fundamentals of Ecosystem Science 137–158 (Elsevier, 2013). ISBN 978-0-12-088774-3.
  21. Scheer, C. et al. Estimating global terrestrial denitrification from measured N2O:(N2O + N2) product ratios. Curr. Opin. Environ. Sustain. 47, 72–80 (2020). https://doi.org/10.1016/j.cosust.2020.07.005
  22. Powlson, D. S. et al. Through the eye of the needle — The story of the soil microbial biomass. in Microbial Biomass: A paradigm shift in terrestrial biogeochemistry (ed. Tate, K. R.) Chapter 1 (World Scientific Publ Co Pte Ltd, 2017). ISBN 978-1-78634-130-3.
  23. Schimel, J. P. et al. Nitrogen Mineralization: Challenges of a Changing Paradigm. Ecology 85, 591–602 (2004). https://doi.org/10.1890/03-8002
  24. Batjes, N. h. Total carbon and nitrogen in the soils of the world. Eur. J. Soil Sci. 47, 151–163 (1996). https://doi.org/10.1111/j.1365-2389.1996.tb01386.x
  25. Xu, X. et al. A global analysis of soil microbial biomass carbon, nitrogen and phosphorus in terrestrial ecosystems. Glob. Ecol. Biogeogr. 22, 737–749 (2013). https://doi.org/10.1111/geb.12029
  26. Matschullat, J. et al. GEMAS: CNS concentrations and C/N ratios in European agricultural soil. Sci. Total Environ. 627, 975–984 (2018). https://doi.org/10.1016/j.scitotenv.2018.01.214
  27. Fowler, D. et al. The global nitrogen cycle in the twenty-first century. Phil Trans R Soc B 368, 20130164 (2013). https://doi.org/10.1098/rstb.2013.0164
  28. Duce, R. A. et al. Impacts of Atmospheric Anthropogenic Nitrogen on the Open Ocean. Science 320, 893– 897 (2008). https://doi.org/10.1126/science.1150369
  29. Van Meter, K. J. et al. The nitrogen legacy: emerging evidence of nitrogen accumulation in anthropogenic landscapes. Environ. Res. Lett. 11, 035014 (2016). https://doi.org/10.1088/1748-9326/11/3/035014
  30. Breewood, H. et al. What is feed-food competition? 2020) https://doi.org/10.56661/dde79ca0
  31. Fraanje, W. et al. Soy: food, feed, and land use change. (2020) https://doi.org/10.56661/47e58c32
  32. Einarsson, R. et al. Crop production and nitrogen use in European cropland and grassland 1961-2019. Sci. Data 8, 1–29 (2021). https://doi.org/10.1038/s41597-021-01061-z
  33. Bouwman, L. et al. Exploring global changes in nitrogen and phosphorus cycles in agriculture induced by livestock production over the 1900–2050 period. Proc. Natl. Acad. Sci. 110, 20882–20887 (2013). https://doi. org/10.1073/pnas.1012878108
  34. Zhang, X. et al. Managing nitrogen for sustainable development. Nature 528, 51–59 (2015). https://doi. org/10.1038/nature15743
  35. Garnett, T. et al. Lean, green, mean, obscene...? What is efficiency? And is it sustainable? Animal production and consumption reconsidered. (2015).
  36. Breewood, H. et al. Meat, metrics and mindsets: Exploring debates on the role of livestock and alternatives in diets and farming. (2023) https://doi.org/10.56661/d8817170
  37. Morée, A. L. et al. Exploring global nitrogen and phosphorus flows in urban wastes during the twentieth century. Glob. Biogeochem. Cycles 27, 836–846 (2013). https://doi.org/10.1002/gbc.20072
  38. Harder,R.etal.Recyclingnutrientscontainedinhumanexcretatoagriculture:Pathways,processes,and products. Crit. Rev. Environ. Sci. Technol. 49, 695–743 (2019). https://doi.org/10.1080/10643389.2018.1558889
  39. Esculier, F. et al. Past and Future Trajectories of Human Excreta Management Systems: Paris in the Nineteenth to Twenty-First Centuries. in The Seine River Basin (eds. Flipo, N. et al.) 117–140 (Springer International Publishing, 2021). ISBN 978-3-030-54260-3. https://doi.org/10.1007/698_2019_407
  40. Herrero, M. et al. Biomass use, production, feed efficiencies, and greenhouse gas emissions from global livestock systems. Proc. Natl. Acad. Sci. 110, 20888–20893 (2013). https://doi.org/10.1073/pnas.1308149110
  41. Uwizeye, A. et al. Nitrogen emissions along global livestock supply chains. Nat. Food 1, 437–446 (2020). https://doi.org/10.1038/s43016-020-0113-y
  42. Lemaire, G. et al. Integrated crop–livestock systems: Strategies to achieve synergy between agricultural production and environmental quality. Agric. Ecosyst. Environ. 190, 4–8 (2014). https://doi.org/10.1016/j.agee.2013.08.009
  43. Van Zanten, H. H. E. et al. Defining a land boundary for sustainable livestock consumption. Glob. Change Biol. 24, 4185–4194 (2018). https://doi.org/10.1111/gcb.14321
  44. Amon, B. et al. 3B Manure Management. in EMEP/EEA air pollutant emission inventory guidebook 2019 (Publications Office of the European Union, 2019). ISBN 978-92-9480-098-5.
  45. Options for Ammonia Mitigation: Guidance from the UNECE Task Force on Reactive Nitrogen. (Centre for Ecology & Hydrology, 2014). ISBN 978-1-906698-46-1.
  46. Nitrogen Opportunities for Agriculture, Food & Environment. UNECE Guidance Document on Integrated Sustainable Nitrogen Management. (UK Centre for Ecology & Hydrology, 2022). ISBN 978-1-906698-78-2.
  47. Edixhoven, J. D. et al. Recent revisions of phosphate rock reserves and resources: a critique. Earth Syst. Dyn. 5, 491–507 (2014). https://doi.org/10.5194/esd-5-491-2014
  48. Zou, T. et al. Global trends of cropland phosphorus use and sustainability challenges. Nature 611, 81–87 (2022). https://doi.org/10.1038/s41586-022-05220-z
  49. Jasinski, S. M. Phosphate rock (2023). http://pubs.usgs.gov/periodicals/mcs2023/mcs2023-phosphate.pdf
  50. Powers, S. M. et al. Long-term accumulation and transport of anthropogenic phosphorus in three river basins. Nat. Geosci. 9, 353–356 (2016). https://doi.org/10.1038/ngeo2693
  51. Némery, J. et al. The fate of phosphorus. Nat. Geosci. 9, 343–344 (2016). https://doi.org/10.1038/ngeo2702
  52. Tóth, G. et al. Phosphorus levels in croplands of the European Union with implications for P fertilizer use. Eur. J. Agron. 55, 42–52 (2014). https://doi.org/10.1016/j.eja.2013.12.008
  53. van Dijk, K. C. et al. Phosphorus flows and balances of the European Union Member States. Sci. Total Environ. 542, 1078–1093 (2016). https://doi.org/10.1016/j.scitotenv.2015.08.048
  54. Bergström, L. et al. Turnover and Losses of Phosphorus in Swedish Agricultural Soils: Long-Term Changes, Leaching Trends, and Mitigation Measures. J. Environ. Qual. 44, 512–523 (2015). https://doi.org/10.2134/jeq2014.04.0165
  55. Galloway, J. N. et al. A chronology of human understanding of the nitrogen cycle. Philos. Trans. R. Soc. B Biol. Sci. 368, 20130120 (2013). https://doi.org/10.1098/rstb.2013.0120
  56. Michaud, R. et al. World Distribution and Historical Development. in Alfalfa and Alfalfa Improvement 25–91 (John Wiley & Sons, Ltd, 1988). ISBN 978-0-89118-222-1. https://doi.org/10.2134/agronmonogr29.c2
  57. Kjærgaard, T. A Plant that Changed the World: The rise and fall of clover 1000-2000. Landsc. Res. 28, 41–49 (2003). https://doi.org/10.1080/01426390306531
  58. Galloway, J. N. et al. Nitrogen Cycles: Past, Present, and Future. Biogeochemistry 70, 153–226 (2004). https://doi.org/10.1007/s10533-004-0370-0
  59. Anglade, J. et al. Relationships for estimating N2 fixation in legumes: incidence for N balance of legume- based cropping systems in Europe. Ecosphere 6, 1–24 (2015). https://doi.org/10.1890/ES14-00353.1
  60. Peoples, M. B. et al. The contributions of nitrogen-fixing crop legumes to the productivity of agricultural systems. Symbiosis 48, 1–17 (2009). https://doi.org/10.1007/BF03179980
  61. Ladha, J. K. et al. Global nitrogen budgets in cereals: A 50-year assessment for maize, rice and wheat production systems. Sci. Rep. 6, 19355 (2016). https://doi.org/10.1038/srep19355
  62. Lal, R. et al. Evolution of the plow over 10,000 years and the rationale for no-till farming. Soil Tillage Res. 93, 1–12 (2007). https://doi.org/10.1016/j.still.2006.11.004
  63. David, M. B. et al. Estimated Historical and Current Nitrogen Balances for Illinois. Sci. World J. 1, 597–604 (2001). https://doi.org/10.1100/tsw.2001.283
  64. Giller, K. E. et al. Building Soil Nitrogen Capital in Africa. in Replenishing Soil Fertility in Africa 151–192 (John Wiley & Sons, Ltd, 1997). ISBN 978-0-89118-946-6. https://doi.org/10.2136/sssaspecpub51.c7
  65. Rufino, M. C. et al. Nitrogen cycling efficiencies through resource-poor African crop–livestock systems. Agric. Ecosyst. Environ. 112, 261–282 (2006). https://doi.org/10.1016/j.agee.2005.08.028
  66. Chorley, G. P. H. The Agricultural Revolution in Northern Europe, 1750-1880: Nitrogen, Legumes, and Crop Productivity. Econ. Hist. Rev. 34, 71–93 (1981). https://doi.org/10.2307/2594840
  67. Naylor, R. et al. Losing the Links Between Livestock and Land. Science 310, 1621–1622 (2005). https://doi.org/10.1126/science.1117856
  68. Le Noë, J. et al. Long-term socioecological trajectories of agro-food systems revealed by N and P flows in French regions from 1852 to 2014. Agric. Ecosyst. Environ. 265, 132–143 (2018). https://doi.org/10.1016/j.agee.2018.06.006
  69. Spiegal, S. et al. Manuresheds: Advancing nutrient recycling in US agriculture. Agric. Syst. 182, 102813 (2020). https://doi.org/10.1016/j.agsy.2020.102813
  70. Einarsson, R. et al. Subnational nutrient budgets to monitor environmental risks in EU agriculture: calculating phosphorus budgets for 243 EU28 regions using public data. Nutr. Cycl. Agroecosystems 117, 199–213 (2020). https://doi.org/10.1007/s10705-020-10064-y
  71. Geisseler, D. et al. Long-term effects of mineral fertilizers on soil microorganisms – A review. Soil Biol. Biochem. 75, 54–63 (2014). https://doi.org/10.1016/j.soilbio.2014.03.023
  72. Francioli, D. et al. Mineral vs. Organic Amendments: Microbial Community Structure, Activity and Abundance of Agriculturally Relevant Microbes Are Driven by Long-Term Fertilization Strategies. Front. Microbiol. 7, (2016).
  73. Gao, Y. et al. Greenhouse gas emissions from nitrogen fertilizers could be reduced by up to one-fifth of current levels by 2050 with combined interventions. Nat. Food 4, 170–178 (2023). https://doi.org/10.1038/s43016-023-00698-w
  74. Crippa, M. et al. Food systems are responsible for a third of global anthropogenic GHG emissions. Nat. Food 2, 198–209 (2021). https://doi.org/10.1038/s43016-021-00225-9
  75. Hoxha, A. et al. The carbon footprint of fertiliser production: regional reference values. in Proceedings No 805 (International Fertiliser Society, 2018). ISBN 978-0-85310-442-1.
  76. Peoples, M. B. et al. Chapter 8 - The Contributions of Legumes to Reducing the Environmental Risk of Agricultural Production. in Agroecosystem Diversity (eds. Lemaire, G. et al.) 123–143 (Academic Press, 2019). ISBN 978-0-12-811050-8 doi:10.1016/B978-0-12-811050-8.00008-X. https://doi.org/10.1016/B978-0-12-811050-8.00008-X
  77. Billen, G. et al. Reshaping the European agro-food system and closing its nitrogen cycle: The potential of combining dietary change, agroecology, and circularity. One Earth 4, 839–850 (2021). https://doi.org/10.1016/j.oneear.2021.05.008
  78. Billen, G. et al. Beyond the Farm to Fork Strategy: Methodology for designing a European agro-ecological future. Sci. Total Environ. 908, 168160 (2024). https://doi.org/10.1016/j.scitotenv.2023.168160
  79. Einarsson, R. et al. The relative productivity of organic agriculture must be considered in the full food-system context. A comment on Connor (2022). Agric. Syst. 199, 103413 (2022). https://doi.org/10.1016/j.agsy.2022.103413
  80. Diacono, M. et al. Long-term effects of organic amendments on soil fertility. A review. Agron. Sustain. Dev. 30, 401–422 (2010). https://doi.org/10.1051/agro/2009040
  81. MacLaren, C. et al. Long-term evidence for ecological intensification as a pathway to sustainable agriculture. Nat. Sustain. 5, 770–779 (2022). https://doi.org/10.1038/s41893-022-00911-x
  82. Powlson, D. S. Soil health—useful terminology for communication or meaningless concept? Or both? Front. Agric. Sci. Eng. 7, 246–250 (2020). https://doi.org/10.15302/J-FASE-2020326
  83. Goulding, K. W. T. Soil acidification and the importance of liming agricultural soils with particular reference to the United Kingdom. Soil Use Manag. 32, 390–399 (2016). https://doi.org/10.1111/sum.12270
  84. Jensen, E. S. et al. How can increased use of biological N2 fixation in agriculture benefit the environment? Plant Soil 252, 177–186 (2003). https://doi.org/10.1023/A:1024189029226
  85. Vira, J. et al. An improved mechanistic model for ammonia volatilization in Earth system models: Flow of Agricultural Nitrogen version 2 (FANv2). Geosci. Model Dev. 13, 4459–4490 (2020). https://doi.org/10.5194/gmd-13-4459-2020
  86. Schulte-Uebbing, L. F. et al. From planetary to regional boundaries for agricultural nitrogen pollution. Nature 610, 507–512 (2022). https://doi.org/10.1038/s41586-022-05158-2
  87. Beaudor, M. et al. Global agricultural ammonia emissions simulated with the ORCHIDEE land surface model. Geosci. Model Dev. 16, 1053–1081 (2023). https://doi.org/10.5194/gmd-16-1053-2023
  88. Erisman, J. W. et al. Reduced nitrogen in ecology and the environment. Environ. Pollut. 150, 140–149 (2007). https://doi.org/10.1016/j.envpol.2007.06.033
  89. Gu, B. et al. Abating ammonia is more cost-effective than nitrogen oxides for mitigating PM2.5 air pollution. Science 374, 758–762 (2021). https://doi.org/10.1126/science.abf8623
  90. Henryson, K. et al. Spatially differentiated midpoint indicator for marine eutrophication of waterborne emissions in Sweden. Int. J. Life Cycle Assess. 1–12 (2017). https://doi.org/10.1007/s11367-017-1298-7
  91. Smith, V. H. et al. Eutrophication science: where do we go from here? Trends Ecol. Evol. 24, 201–207 (2009). https://doi.org/10.1016/j.tree.2008.11.009
  92. Wurtsbaugh, W. A. et al. Nutrients, eutrophication and harmful algal blooms along the freshwater to marine continuum. WIREs Water 6, e1373 (2019). https://doi.org/10.1002/wat2.1373
  93. Erisman, J. W. et al. Consequences of human modification of the global nitrogen cycle. Phil Trans R Soc B 368, 20130116 (2013). https://doi.org/10.1098/rstb.2013.0116
  94. Suntharalingam, P. et al. Quantifying the impact of anthropogenic nitrogen deposition on oceanic nitrous oxide. Geophys. Res. Lett. 39, (2012). https://doi.org/10.1029/2011GL050778
  95. Erisman, J. W. et al. Reactive nitrogen in the environment and its effect on climate change. Curr. Opin. Environ. Sustain. 3, 281–290 (2011). https://doi.org/10.1016/j.cosust.2011.08.012
  96. Beaulieu, J. J. et al. Eutrophication will increase methane emissions from lakes and impoundments during the 21st century. Nat. Commun. 10, 1375 (2019). https://doi.org/10.1038/s41467-019-09100-5
  97. WHO. Guidelines for drinking-water quality. Fourth edition incorporating the first and second addenda. (World Health Organization, 2022). ISBN 978-92-4-004506-4.
  98. Kotopoulou, S. et al. Dietary nitrate and nitrite and human health: a narrative review by intake source. Nutr. Rev. 80, 762–773 (2022). https://doi.org/10.1093/nutrit/nuab113
  99. Ward, M. H. et al. Drinking Water Nitrate and Human Health: An Updated Review. Int. J. Environ. Res. Public. Health 15, 1557 (2018). https://doi.org/10.3390/ijerph15071557
  100. Lundberg, J. O. et al. Metabolic Effects of Dietary Nitrate in Health and Disease. Cell Metab. 28, 9–22 (2018). https://doi.org/10.1016/j.cmet.2018.06.007
  101. Schullehner, J. et al. Nitrate in drinking water and colorectal cancer risk: A nationwide population-based cohort study. Int. J. Cancer 143, 73–79 (2018). https://doi.org/10.1002/ijc.31306
  102. EFSA Panel on Food Additives and Nutrient Sources added to Food (ANS) et al. Re-evaluation of sodium nitrate (E 251) and potassium nitrate (E 252) as food additives. EFSA J. 15, e04787 (2017). https://doi.org/10.2903/j.efsa.2017.4787
  103. Tian, H. et al. A comprehensive quantification of global nitrous oxide sources and sinks. Nature 586, 248–256 (2020). https://doi.org/10.1038/s41586-020-2780-0
  104. Reay, D. S. et al. Global agriculture and nitrous oxide emissions. Nat. Clim. Change 2, 410–416 (2012). https://doi.org/10.1038/nclimate1458
  105. Crutzen, P. et al. N2O Release from Agro-biofuel Production Negates Global Warming Reduction by Replacing Fossil Fuels. Atmospheric Chem. Phys. 8, 389–395 (2008). https://doi.org/10.1007/978-3-319-27460-7_12
  106. The Earth’s Energy Budget, Climate Feedbacks, and Climate Sensitivity. [Chapter 7]. in Climate Change 2021: The Physical Science Basis. Contribution of Working Group I to the Sixth Assessment Report of the Intergovernmental Panel on Climate Change (eds. Forster, P. et al.) 923–1054 (Cambridge University Press, 2021). https://doi.org/10.1017/9781009157896.009
  107. Tubiello, F. N. et al. Greenhouse gas emissions from food systems: building the evidence base. Environ. Res. Lett. 16, 065007 (2021). https://doi.org/10.1088/1748-9326/ac018e
  108. Ravishankara, A. R. et al. Nitrous Oxide (N2O): The Dominant Ozone-Depleting Substance Emitted in the 21st Century. Science 326, 123–125 (2009). https://doi.org/10.1126/science.1176985
  109. Jaeglé, L. et al. Global partitioning of NO× sources using satellite observations: Relative roles of fossil fuel combustion, biomass burning and soil emissions. Faraday Discuss. 130, 407–423 (2005). https://doi.org/10.1039/B502128F
  110. Woods, J. et al. Energy and the food system. Philos. Trans. R. Soc. B Biol. Sci. 365, 2991–3006 (2010). https://doi.org/10.1098/rstb.2010.0172
  111. Paris, B. et al. Energy use in open-field agriculture in the EU: A critical review recommending energy efficiency measures and renewable energy sources adoption. Renew. Sustain. Energy Rev. 158, 112098 (2022). https://doi.org/10.1016/j.rser.2022.112098
  112. Soana, E. et al. Soil Denitrification, the Missing Piece in the Puzzle of Nitrogen Budget in Lowland Agricultural Basins. Ecosystems 25, 633–647 (2022). https://doi.org/10.1007/s10021-021-00676-y
  113. Galloway, J. N. et al. The Nitrogen Cascade. BioScience 53, 341–356 (2003). https://doi.org/10.1641/0006-3568(2003)053[0341:TNC]2.0.CO;2
  114. Simpson, D. et al. Atmospheric transport and deposition of reactive nitrogen in Europe. in The European Nitrogen Assessment: Sources, Effects and Policy Perspectives 298–316 (Cambridge University Press, 2011). ISBN 978-0-511-97698-8.
  115. Vieno, M. et al. The UK particulate matter air pollution episode of March–April 2014: more than Saharan dust. Environ. Res. Lett. 11, 044004 (2016). https://doi.org/10.1088/1748-9326/11/4/044004
  116. Van Damme, M. et al. Industrial and agricultural ammonia point sources exposed. Nature 564, 99–103 (2018). https://doi.org/10.1038/s41586-018-0747-1
  117. Billen, G. et al. Nitrogen biogeochemistry of water-agro-food systems: the example of the Seine land-to-sea continuum. Biogeochemistry (2021). https://doi.org/10.1007/s10533-020-00739-7
  118. Van Meter, K. J. et al. Catchment Legacies and Time Lags: A Parsimonious Watershed Model to Predict the Effects of Legacy Storage on Nitrogen Export. PLOS ONE 10, e0125971 (2015). https://doi.org/10.1371/journal.pone.0125971
  119. Vonk, W. J. et al. The legacy effect of synthetic N fertiliser. Eur. J. Soil Sci. 73, e13238 (2022). https://doi.org/10.1111/ejss.13238
  120. Sutton, M. A. et al. Alkaline air: changing perspectives on nitrogen and air pollution in an ammonia-rich world. Philos. Trans. R. Soc. Math. Phys. Eng. Sci. 378, 20190315 (2020). https://doi.org/10.1098/rsta.2019.0315
  121. Seitzinger, S. et al. Denitrification Across Landscapes and Waterscapes: A Synthesis. Ecol. Appl. 16, 2064– 2090 (2006). https://doi.org/10.1890/1051-0761(2006)016[2064:DALAWA]2.0.CO;2
  122. Davidson, E. A. et al. The Enigma of Progress in Denitrification Research. Ecol. Appl. 16, 2057–2063 (2006). https://doi.org/10.1890/1051-0761(2006)016[2057:TEOPID]2.0.CO;2
  123. Garnier, J. et al. N:P:Si nutrient export ratios and ecological consequences in coastal seas evaluated by the ICEP approach. Glob. Biogeochem. Cycles 24, (2010). https://doi.org/10.1029/2009GB003583
  124. Wang, B. et al. A historical overview of coastal eutrophication in the China Seas. Mar. Pollut. Bull. 136, 394–400 (2018). https://doi.org/10.1016/j.marpolbul.2018.09.044
  125. van Grinsven, H. J. M. et al. Reducing external costs of nitrogen pollution by relocation of pig production between regions in the European Union. Reg. Environ. Change (2018) https://doi.org/10.1007/s10113-018-1335-5
  126. Schullehner, J. et al. Nitrate exposure from drinking water in Denmark over the last 35 years. Environ. Res. Lett. 9, 095001 (2014). https://doi.org/10.1088/1748-9326/9/9/095001
  127. van Grinsven, H. J. M. et al. Costs and Benefits of Nitrogen for Europe and Implications for Mitigation. Environ. Sci. Technol. 47, 3571–3579 (2013). https://doi.org/10.1021/es303804g
  128. Pinder, R. W. et al. Impacts of human alteration of the nitrogen cycle in the US on radiative forcing. Biogeochemistry 114, 25–40 (2013). https://doi.org/10.1007/s10533-012-9787-z
  129. de Vries, W. et al. Short and long-term impacts of nitrogen deposition on carbon sequestration by forest ecosystems. Curr. Opin. Environ. Sustain. 9–10, 90–104 (2014). https://doi.org/10.1016/j.cosust.2014.09.001
  130. Du, E. et al. Nitrogen-induced new net primary production and carbon sequestration in global forests. Environ. Pollut. 242, 1476–1487 (2018). https://doi.org/10.1016/j.envpol.2018.08.041
  131. Schulte-Uebbing, L. F. et al. Experimental evidence shows minor contribution of nitrogen deposition to global forest carbon sequestration. Glob. Change Biol. 28, 899–917 (2022). https://doi.org/10.1111/gcb.15960
  132. Xing, A. et al. Nonlinear responses of ecosystem carbon fluxes to nitrogen deposition in an old-growth boreal forest. Ecol. Lett. 25, 77–88 (2022). https://doi.org/10.1111/ele.13906
  133. Jickells, T. D. et al. A reevaluation of the magnitude and impacts of anthropogenic atmospheric nitrogen inputs on the ocean. Glob. Biogeochem. Cycles 31, 289–305 (2017). https://doi.org/10.1002/2016GB005586
  134. Altieri, K. E. et al. Reactive Nitrogen Cycling in the Atmosphere and Ocean. Annu. Rev. Earth Planet. Sci. 49, 523–550 (2021). https://doi.org/10.1146/annurev-earth-083120-052147
  135. Reis, S. et al. Reactive nitrogen in atmospheric emission inventories. Atmospheric Chem. Phys. 9, 7657–7677 (2009). https://doi.org/10.5194/acp-9-7657-2009
  136. Gu, B. et al. Cost-effective mitigation of nitrogen pollution from global croplands. Nature 613, 77–84 (2023). https://doi.org/10.1038/s41586-022-05481-8
  137. Rockström, J. et al. A safe operating space for humanity. Nature 461, 472–475 (2009). https://doi.org/10.1038/461472a
  138. Steffen, W. et al. Planetary boundaries: Guiding human development on a changing planet. Science 347, (2015). https://doi.org/10.1126/science.1259855
  139. Rockström, J. et al. Safe and just Earth system boundaries. Nature 1–10 (2023) doi:10.1038/s41586-023- 06083-8. https://doi.org/10.1038/s41586-023-06083-8
  140. de Vries, W. et al. Assessing planetary and regional nitrogen boundaries related to food security and adverse environmental impacts. Curr. Opin. Environ. Sustain. 5, 392–402 (2013). https://doi.org/10.1016/j.cosust.2013.07.004
  141. Schlesinger, W. H. Planetary boundaries: Thresholds risk prolonged degradation. Nat. Clim. Change 1, 112–113 (2009). https://doi.org/10.1038/climate.2009.93
  142. Scheffer, M. et al. Catastrophic shifts in ecosystems. Nature 413, 591–596 (2001). https://doi.org/10.1038/35098000
  143. Bobbink, R. et al. Global assessment of nitrogen deposition effects on terrestrial plant diversity: a synthesis. Ecol. Appl. 20, 30–59 (2010). https://doi.org/10.1890/08-1140.1
  144. Camargo, J. A. et al. Ecological and toxicological effects of inorganic nitrogen pollution in aquatic ecosystems: A global assessment. Environ. Int. 32, 831–849 (2006). https://doi.org/10.1016/j.envint.2006.05.002
  145. Poikane, S. et al. Nutrient criteria for surface waters under the European Water Framework Directive: Current state-of-the-art, challenges and future outlook. Sci. Total Environ. 695, 133888 (2019). https://doi.org/10.1016/j.scitotenv.2019.133888
  146. Brewer, P. Planetary boundaries: Consider all consequences. Nat. Clim. Change 1, 117–118 (2009). https://doi.org/10.1038/climate.2009.98
  147. Einarsson, R. et al. Healthy diets and sustainable food systems. The Lancet 394, 215 (2019). https://doi.org/10.1016/S0140-6736(19)31116-X
  148. Bodirsky, B. L. et al. Reactive nitrogen requirements to feed the world in 2050 and potential to mitigate nitrogen pollution. Nat. Commun. 5, 3858 (2014).
  149. Springmann, M. et al. Options for keeping the food system within environmental limits. Nature 562, 519–525 (2018). https://doi.org/10.1038/s41586-018-0594-0
  150. European Commission. COM(2020) 381 final. A Farm to Fork Strategy for a fair, healthy and environmentally- friendly food system. (2020).
  151. CBD. Kunming-Montreal Global Biodiversity Framework. Decision 15/4 of the Conference of the Parties to the Convention on Biological Diversity. (2022).
  152. Davidson, E. A. et al. Testing a Conceptual Model of Soil Emissions of Nitrous and Nitric Oxides: Using two functions based on soil nitrogen availability and soil water content, the hole-in-the-pipe model characterizes a large fraction of the observed variation of nitric oxide and nitrous oxide emissions from soils. BioScience 50, 667–680 (2000). https://doi.org/10.1641/0006-3568(2000)050[0667:TACMOS]2.0.CO;2
  153. Oenema, O. et al. Integrated assessment of promising measures to decrease nitrogen losses from agriculture in EU-27. Agric. Ecosyst. Environ. 133, 280–288 (2009). https://doi.org/10.1016/j.agee.2009.04.025
  154. Lassaletta, L. et al. Nitrogen use efficiency of tomorrow. Nat. Food 4, 281–282 (2023). https://doi.org/10.1038/s43016-023-00740-x
  155. Mueller, N. D. et al. Closing yield gaps through nutrient and water management. Nature 490, 254–257 (2012). https://doi.org/10.1038/nature11420
  156. Bommarco, R. et al. Ecological intensification: harnessing ecosystem services for food security. Trends Ecol. Evol. 28, 230–238 (2013). https://doi.org/10.1016/j.tree.2012.10.012
  157. MacLaren, C. et al. Livestock in diverse cropping systems improve weed management and sustain yields whilst reducing inputs. J. Appl. Ecol. 56, 144–156 (2019). https://doi.org/10.1111/1365-2664.13239
  158. Fan, D. et al. Global evaluation of inhibitor impacts on ammonia and nitrous oxide emissions from agricultural soils: A meta-analysis. Glob. Change Biol. 28, 5121–5141 (2022). https://doi.org/10.1111/gcb.16294
  159. Fangueiro, D. et al. Acidification of animal slurry– a review. J. Environ. Manage. 149, 46–56 (2015). https://doi.org/10.1016/j.jenvman.2014.10.001
  160. Beyers, M. et al. Effect of natural and regulatory conditions on the environmental impacts of pig slurry acidification across different regions in Europe: A life cycle assessment. J. Clean. Prod. 368, 133072 (2022). https://doi.org/10.1016/j.jclepro.2022.133072
  161. Gustavsson, J. et al. The methodology of the FAO study: “Global Food Losses and Food Waste - extent, causes and prevention”- FAO, 201. 70 (2013).
  162. Xue, L. et al. Missing Food, Missing Data? A Critical Review of Global Food Losses and Food Waste Data. Environ. Sci. Technol. 51, 6618–6633 (2017). https://doi.org/10.1021/acs.est.7b00401
  163. Alexander, P. et al. Losses, inefficiencies and waste in the global food system. Agric. Syst. 153, 190–200 (2017). https://doi.org/10.1016/j.agsy.2017.01.014
  164. Corrado, S. et al. Food waste accounting along global and European food supply chains: State of the art and outlook. Waste Manag. 79, 120–131 (2018). https://doi.org/10.1016/j.wasman.2018.07.032
  165. UNEP. Food Waste Index Report 2021. (United Nations Environment Programme, 2021). ISBN 978-92-807- 3868-1.
  166. Dong, H. et al. Emissions from livestock and manure management (Chapter 10). in 2006 IPCC Guidelines for National Greenhouse Gas Inventories, Volume 4 Agriculture, Forestry and Other Land Use (2006).
  167. FAO. Global Livestock Environmental Assessment Model. Model description Version 3.0. (FAO, 2022)
  168. Pandey, B. et al. Technologies to recover nitrogen from livestock manure - A review. Sci. Total Environ. 784, 147098 (2021). https://doi.org/10.1016/j.scitotenv.2021.147098
  169. Swaney, D. P. et al. Nitrogen use efficiency and crop production: Patterns of regional variation in the United States, 1987–2012. Sci. Total Environ. 635, 498–511 (2018). https://doi.org/10.1016/j.scitotenv.2018.04.027
  170. Svanbäck, A. et al. Reducing agricultural nutrient surpluses in a large catchment – Links to livestock density. Sci. Total Environ. 648, 1549–1559 (2019). https://doi.org/10.1016/j.scitotenv.2018.08.194
  171. Mueller, N. D. et al. Declining spatial efficiency of global cropland nitrogen allocation. Glob. Biogeochem. Cycles 31, 2016GB005515 (2017). https://doi.org/10.1002/2016GB005515
  172. Chadwick, D. et al. Improving manure nutrient management towards sustainable agricultural intensification in China. Agric. Ecosyst. Environ. 209, 34–46 (2015). https://doi.org/10.1016/j.agee.2015.03.025
  173. Nesme, T. et al. Effects of crop and livestock segregation on phosphorus resource use: A systematic, regional analysis. Eur. J. Agron. 71, 88–95 (2015). https://doi.org/10.1016/j.eja.2015.08.001
  174. Foley, J. A. et al. Solutions for a cultivated planet. Nature 478, 337–342 (2011). https://doi.org/10.1038/nature10452
  175. Schulte-Uebbing, L. et al. Reconciling food production and environmental boundaries for nitrogen in the European Union. Sci. Total Environ. 786, 147427 (2021). https://doi.org/10.1016/j.scitotenv.2021.147427
  176. FAO et al. A multi-billion-dollar opportunity – Repurposing agricultural support to transform food systems. (FAO, UNDP, and UNEP, 2021). ISBN 978-92-5-134917-5. https://doi.org/10.4060/cb6562en
  177. van Grinsven, H. J. M. et al. Management, regulation and environmental impacts of nitrogen fertilization in northwestern Europe under the Nitrates Directive; a benchmark study. Biogeosciences 9, 5143–5160 (2012). https://doi.org/10.5194/bg-9-5143-2012
  178. Stokstad, E. Nitrogen crisis from jam-packed livestock operations has ‘paralyzed’ Dutch economy. Science (2019). https://doi.org/10.1126/science.aba4504
  179. Beal, T. et al. Global trends in dietary micronutrient supplies and estimated prevalence of inadequate intakes. PLOS ONE 12, e0175554 (2017). https://doi.org/10.1371/journal.pone.0175554
  180. Chen, C. et al. Nutrient Adequacy of Global Food Production. Front. Nutr. 8, (2021).
  181. Billen, G. et al. A vast range of opportunities for feeding the world in 2050: trade-off between diet, N contamination and international trade. Environ. Res. Lett. 10, 025001 (2015). https://doi.org/10.1088/1748-9326/10/2/025001
  182. Chatzimpiros, P. et al. Sevenfold variation in global feeding capacity depends on diets, land use and nitrogen management. Nat. Food 1–12 (2023). https://doi.org/10.1038/s43016-023-00741-w
  183. Willett, W. et al. Food in the Anthropocene: the EAT–Lancet Commission on healthy diets from sustainable food systems. The Lancet (2019). https://doi.org/10.1016/S0140-6736(18)31788-4
  184. Walpole, S. C. et al. The weight of nations: an estimation of adult human biomass. BMC Public Health 12, 439 (2012). https://doi.org/10.1186/1471-2458-12-439
  185. WHO. Protein and Amino Acid Requirements in Human Nutrition. (World Health Organization, 2007). ISBN 978-92-4-120935-9.
  186. Leip, A. et al. Halving nitrogen waste in the European Union food systems requires both dietary shifts and farm level actions. Glob. Food Secur. 35, 100648 (2022). https://doi.org/10.1016/j.gfs.2022.100648
  187. Conijn, J. G. et al. Can our global food system meet food demand within planetary boundaries? Agric. Ecosyst. Environ. 251, 244–256 (2018). https://doi.org/10.1016/j.agee.2017.06.001
  188. Oita, A. et al. Substantial nitrogen pollution embedded in international trade. Nat. Geosci. 9, 111–115 (2016). https://doi.org/10.1038/ngeo2635
  189. Leip, A. et al. Nitrogen Footprints. in Encyclopedia of Ecology (Second Edition) (ed. Fath, B.) 370–382 (Elsevier, 2019). ISBN 978-0-444-64130-4. https://doi.org/10.1016/B978-0-12-409548-9.10753-5
  190. FAO, I. The State of Food Security and Nutrition in the World 2023: Urbanization, agrifood systems transformation and healthy diets across the rural–urban continuum. (FAO, IFAD, UNICEF, WFP, WHO, 2023). ISBN 978-92-5-137226-5. https://doi.org/10.4060/cc3017en
  191. Patel, R. Food sovereignty. J. Peasant Stud. 36, 663–706 (2009). https://doi.org/10.1080/03066150903143079
  192. de Waal, A. Mass Starvation: The History and Future of Famine. (Polity, 2018). ISBN 978-1-5095-2467-9.
  193. Fraanje, W. et al. What is food security? (2018). https://doi.org/10.56661/e49a6c96
  194. Carlile, R. et al. What is food sovereignty? (2021). https://doi.org/10.56661/f07b52cc
  195. Muller, A. et al. Strategies for feeding the world more sustainably with organic agriculture. Nat. Commun. 8, 1290 (2017). https://doi.org/10.1038/s41467-017-01410-w
  196. Morais, T. G. et al. Agroecological measures and circular economy strategies to ensure sufficient nitrogen for sustainable farming. Glob. Environ. Change 69, 102313 (2021). https://doi.org/10.1016/j. gloenvcha.2021.102313
  197. Barbieri, P. et al. Global option space for organic agriculture is delimited by nitrogen availability. Nat. Food 2, 363–372 (2021). https://doi.org/10.1038/s43016-021-00276-y
  198. Billen, G. et al. Two contrasted future scenarios for the French agro-food system. Sci. Total Environ. 637–638, 695–705 (2018). https://doi.org/10.1016/j.scitotenv.2018.05.043
  199. Ponisio, L. C. et al. Diversification practices reduce organic to conventional yield gap. Proc. R. Soc. Lond. B Biol. Sci. 282, (2014). https://doi.org/10.1098/rspb.2014.1396
  200. de Ponti, T. et al. The crop yield gap between organic and conventional agriculture. Agric. Syst. 108, 1–9 (2012). https://doi.org/10.1016/j.agsy.2011.12.004
  201. Röös, E. et al. Risks and opportunities of increasing yields in organic farming. A review. Agron. Sustain. Dev. 38, 14 (2018). https://doi.org/10.1007/s13593-018-0489-3
  202. Searchinger, T. D. et al. Assessing the efficiency of changes in land use for mitigating climate change. Nature 564, 249 (2018). https://doi.org/10.1038/s41586-018-0757-z
  203. Pendrill, F. et al. Disentangling the numbers behind agriculture-driven tropical deforestation. Science 377, eabm9267 (2022). https://doi.org/10.1126/science.abm9267
  204. Ivanovich, C. C. et al. Future warming from global food consumption. Nat. Clim. Change 13, 297–302 (2023). https://doi.org/10.1038/s41558-023-01605-8
  205. Garnett, T. Gut feelings and possible tomorrows: (where) does animal farming fit? https://www. tabledebates.org/publication/gut-feelings-and-possible-tomorrows-where-does-animal-farming-fit (2015)

Term Defintion
Agricultural land Agricultural land is the sum of cropland and permanent grassland.
Ammonia A gas with chemical symbol NH3. Ammonia is formed and used in many biological processes, and can be converted to and from ammonium (NH4+). Emissions of gaseous ammonia from manure, composts, synthetic nitrogen fertilizers, and other materials are major pathways for nitrogen losses from agriculture.
Ammoniacal nitrogen A collective name for nitrogen present as ammonia or ammonium.
Ammonium A positive ion with chemical symbol NH4+. Ammonium is an easily available form of nitrogen nutrition for plants and microbes.
Atmospheric nitrogen deposition Input of nitrogen to soils, plants, or aquatic ecosystems, coming from the atmosphere. Most atmospheric nitrogen deposition is derived from ammonia (NH3) emitted mainly from agriculture, or from nitrogen oxides (NOx) emitted mainly from industrial processes, traffic, and biomass burning.
Biological nitrogen fixation The microbially mediated conversion of atmospheric dinitrogen (N2) gas to ammonia (NH3), which can then be assimilated by microbes, plants, and other organisms. Symbiotic biological nitrogen fixation, carried out with specialized soil bacteria in a symbiosis with legume plants, is the second major input of new reactive nitrogen to food systems after synthetic nitrogen fertilizer.
BNF Acronym for biological nitrogen fixation.
Cropland Cropland is the sum of arable land and permanent crops such as fruits, wine, and olives.
Denitrification Microbially mediated conversion of nitrate (NO3-) via nitrite (NO2-), nitric oxide (NO), nitrous oxide (N2O) and finally to dinitrogen (N2). This is a common and important conversion pathway in soils and aquatic ecosystems. Complete denitrification converts nitrate to dinitrogen (N2), but in practice it is common to see some nitrous oxide (N2O) as a by-product.
Dinitrogen Dinitrogen (N2) is a mostly unreactive gas making up about 78% of the atmosphere.
Haber-Bosch process An industrial chemical process to convert nitrogen and hydrogen gas to ammonia: 2 N2 + 3 H2 → 2 NH3. The Haber-Bosch process is the main process used to produce synthetic nitrogen fertilizers, using about 1-2% of global primary energy.
Industrial ammonia synthesis Industrial conversion of atmospheric dinitrogen (N2) to ammonia (NH3). It is the most important example of industrial nitrogen fixation. Industrial ammonia synthesis is normally carried out using the Haber-Bosch process.
Industrial nitrogen fixation The industrial conversion of atmospheric dinitrogen (N2) gas to bioavailable forms. Most important is the energy-intensive Haber-Bosch process which produces ammonia (NH3) which can then be used to produce various chemicals including synthetic nitrogen fertilizers.
Inorganic nitrogen Nitrogen present in chemically inorganic compounds, i.e., compounds without carbon (C). Important examples of inorganic nitrogen are dinitrogen (N2), ammonia (NH3), nitrate (NO3-), and nitrous oxide (N2O).
Legumes Examples of legumes used in agriculture are beans, lentils, clover, and alfalfa. Legumes supply themselves with nitrogen partly or fully by partnering symbiotically with specialized soil bacteria that convert atmospheric dinitrogen (N2) into bioavailable forms (a process known as symbiotic biological nitrogen fixation).
N Chemical symbol for nitrogen.
N2 Chemical symbol for dinitrogen.
N2O Chemical symbol for nitrous oxide.
New nitrogen New nitrogen is a term sometimes used to refer to nitrogen converted from the abundant atmospheric pool of dinitrogen (N2) gas to bioavailable forms. New nitrogen input to food systems come mainly as synthetic nitrogen fertilizer and from biological nitrogen fixation.
NH3 Chemical symbol for ammonia.
NH4+ Chemical symbol for ammonium.
Nitrate A negative ion with chemical symbol NO3-. Nitrate dissolved in water and washed out from soils (nitrate leaching) is a major pathway for nitrogen losses in agriculture.
Nitric oxide A gas with chemical symbol NO.
Nitrification Microbially mediated conversion of ammonia (NH3) to nitrite (NO2-) and nitrate (NO3-). This is a common and important conversion pathway in soils.
Nitrogen A chemical element with symbol N. In the food system, nitrogen plays a dual role: it is an essential nutrient for all life forms, yet also environmental pollutant causing a range of environmental and human health impacts.
Nitrogen dioxide A gas with chemical symbol NO2.
Nitrogen fixation Conversion of atmospheric dinitrogen (N2) gas to any other form of nitrogen. See also industrial nitrogen fixation and biological nitrogen fixation.
Nitrogen gas A synonym for dinitrogen (N2) gas.
Nitrogen oxides Collective name for nitric oxide (NO) and nitrogen dioxide (NO2), commonly written NOx.
Nitrogen, inorganic See inorganic nitrogen.
Nitrogen, new See new nitrogen.
Nitrogen, organic See organic nitrogen.
Nitrogen, reactive See reactive nitrogen.
Nitrogen, recycled See recycled nitrogen.
Nitrogen, unreactive See unreactive nitrogen.
Nitrous oxide A gas with chemical symbol N2O. Nitrous oxide is a relatively unreactive gas with an average atmospheric lifetime of roughly 100 years. It is a very potent greenhouse gas. Food-system emissions of nitrous oxide come mainly from soils, manure storage, and production of synthetic nitrogen fertilizers. Nitrous oxide accounts very roughly for 10% of the global food system's greenhouse gas emissions (in the GWP100 metric).
NO Chemical symbol for nitric oxide.
NO2 Chemical symbol for nitrogen dioxide.
NO3- Chemical symbol for nitrate.
NOx Informal chemical symbol for nitrogen oxides (NO and NO2).
Organic nitrogen Nitrogen present in chemically organic compounds, i.e., compounds with carbon. Important examples of organic nitrogen is amino acids and proteins, ATP, and urea.
Permanent grassland In agriculture, permanent grassland refers to pastures and meadows that have not seen tillage for at least five years.
Permanent meadows and pastures Pastures and meadows that have not seen tillage for at least five years.
Protein Proteins are a huge class of molecules used by all life forms for a range of different uses. Proteins are long chains of amino acids, consisting to about 16% of nitrogen.
Reactive nitrogen Reactive nitrogen is an informal name for all chemical forms of nitrogen exept dinitrogen (N2) gas. Dinitrogen gas is relatively unreactive compared to other forms of nitrogen. Many forms of reactive nitrogen are readily transformed chemically or biologically to other forms in nature.
Recycled nitrogen In agri-food systems, recycled nitrogen, mainly in the form of livestock manure, is an important nitrogen input to crop production. Recycled nitrogen, however, can never substitute for new nitrogen (see glossary entry on new nitrogen).
Synthetic nitrogen fertilizer Nitrogen fertilizer produced from atmospheric dinitrogen (N2) gas, typically using the energy-intensive Haber-Bosch process.

Post a new comment »

Login or register to comment with your personal account. Anonymous comments require approval to be visible.
CAPTCHA
Planten