Resource
Defra: Family Food 2012
The UK’s Family Food report provides detailed statistics on food and drink purchases, expenditure and the derived nutrient content of those purchases from a large household survey covering the United Kingdom. It looks specifically at the domestic, household level.
Chapters include: purchases and expenditure, energy and nutrient intakes, geographic and demographic comparisons as well as a chapter on dietary trends.
Some of the key points are as follows:
- In real terms, between 2009 and 2012 household spending on food and drink fell by 3.1 per cent and eating out expenditure by 5.6 per cent. Household spending on alcoholic drinks increased by 1.3 per cent over the same period, whilst that bought for consumption outside the home fell by 9.8 per cent.
- The percentage of spend on food continues to be highest for low income households, at 16.6 per cent in 2012, 1.4 percentage points above the 2007 level. Food is the largest item of household expenditure for low income households, after housing, fuel and power costs.
- On average, UK households purchased 4.7 per cent less food in 2012 than in 2007 while spending 17 per cent more. They saved 5.6 per cent by trading down to cheaper products.
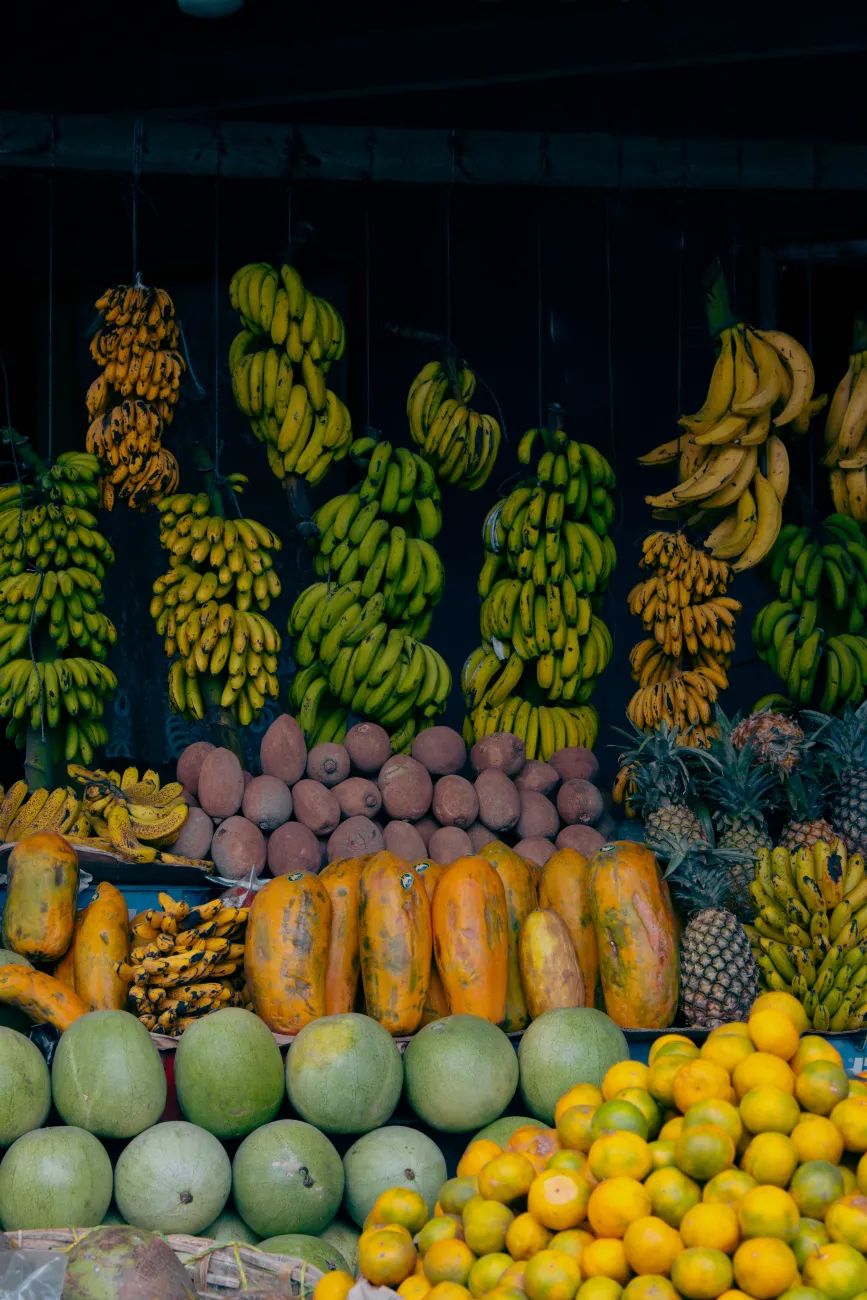
- Fresh vegetable purchases have been declining since 2005 with no statistical trend since 2009.
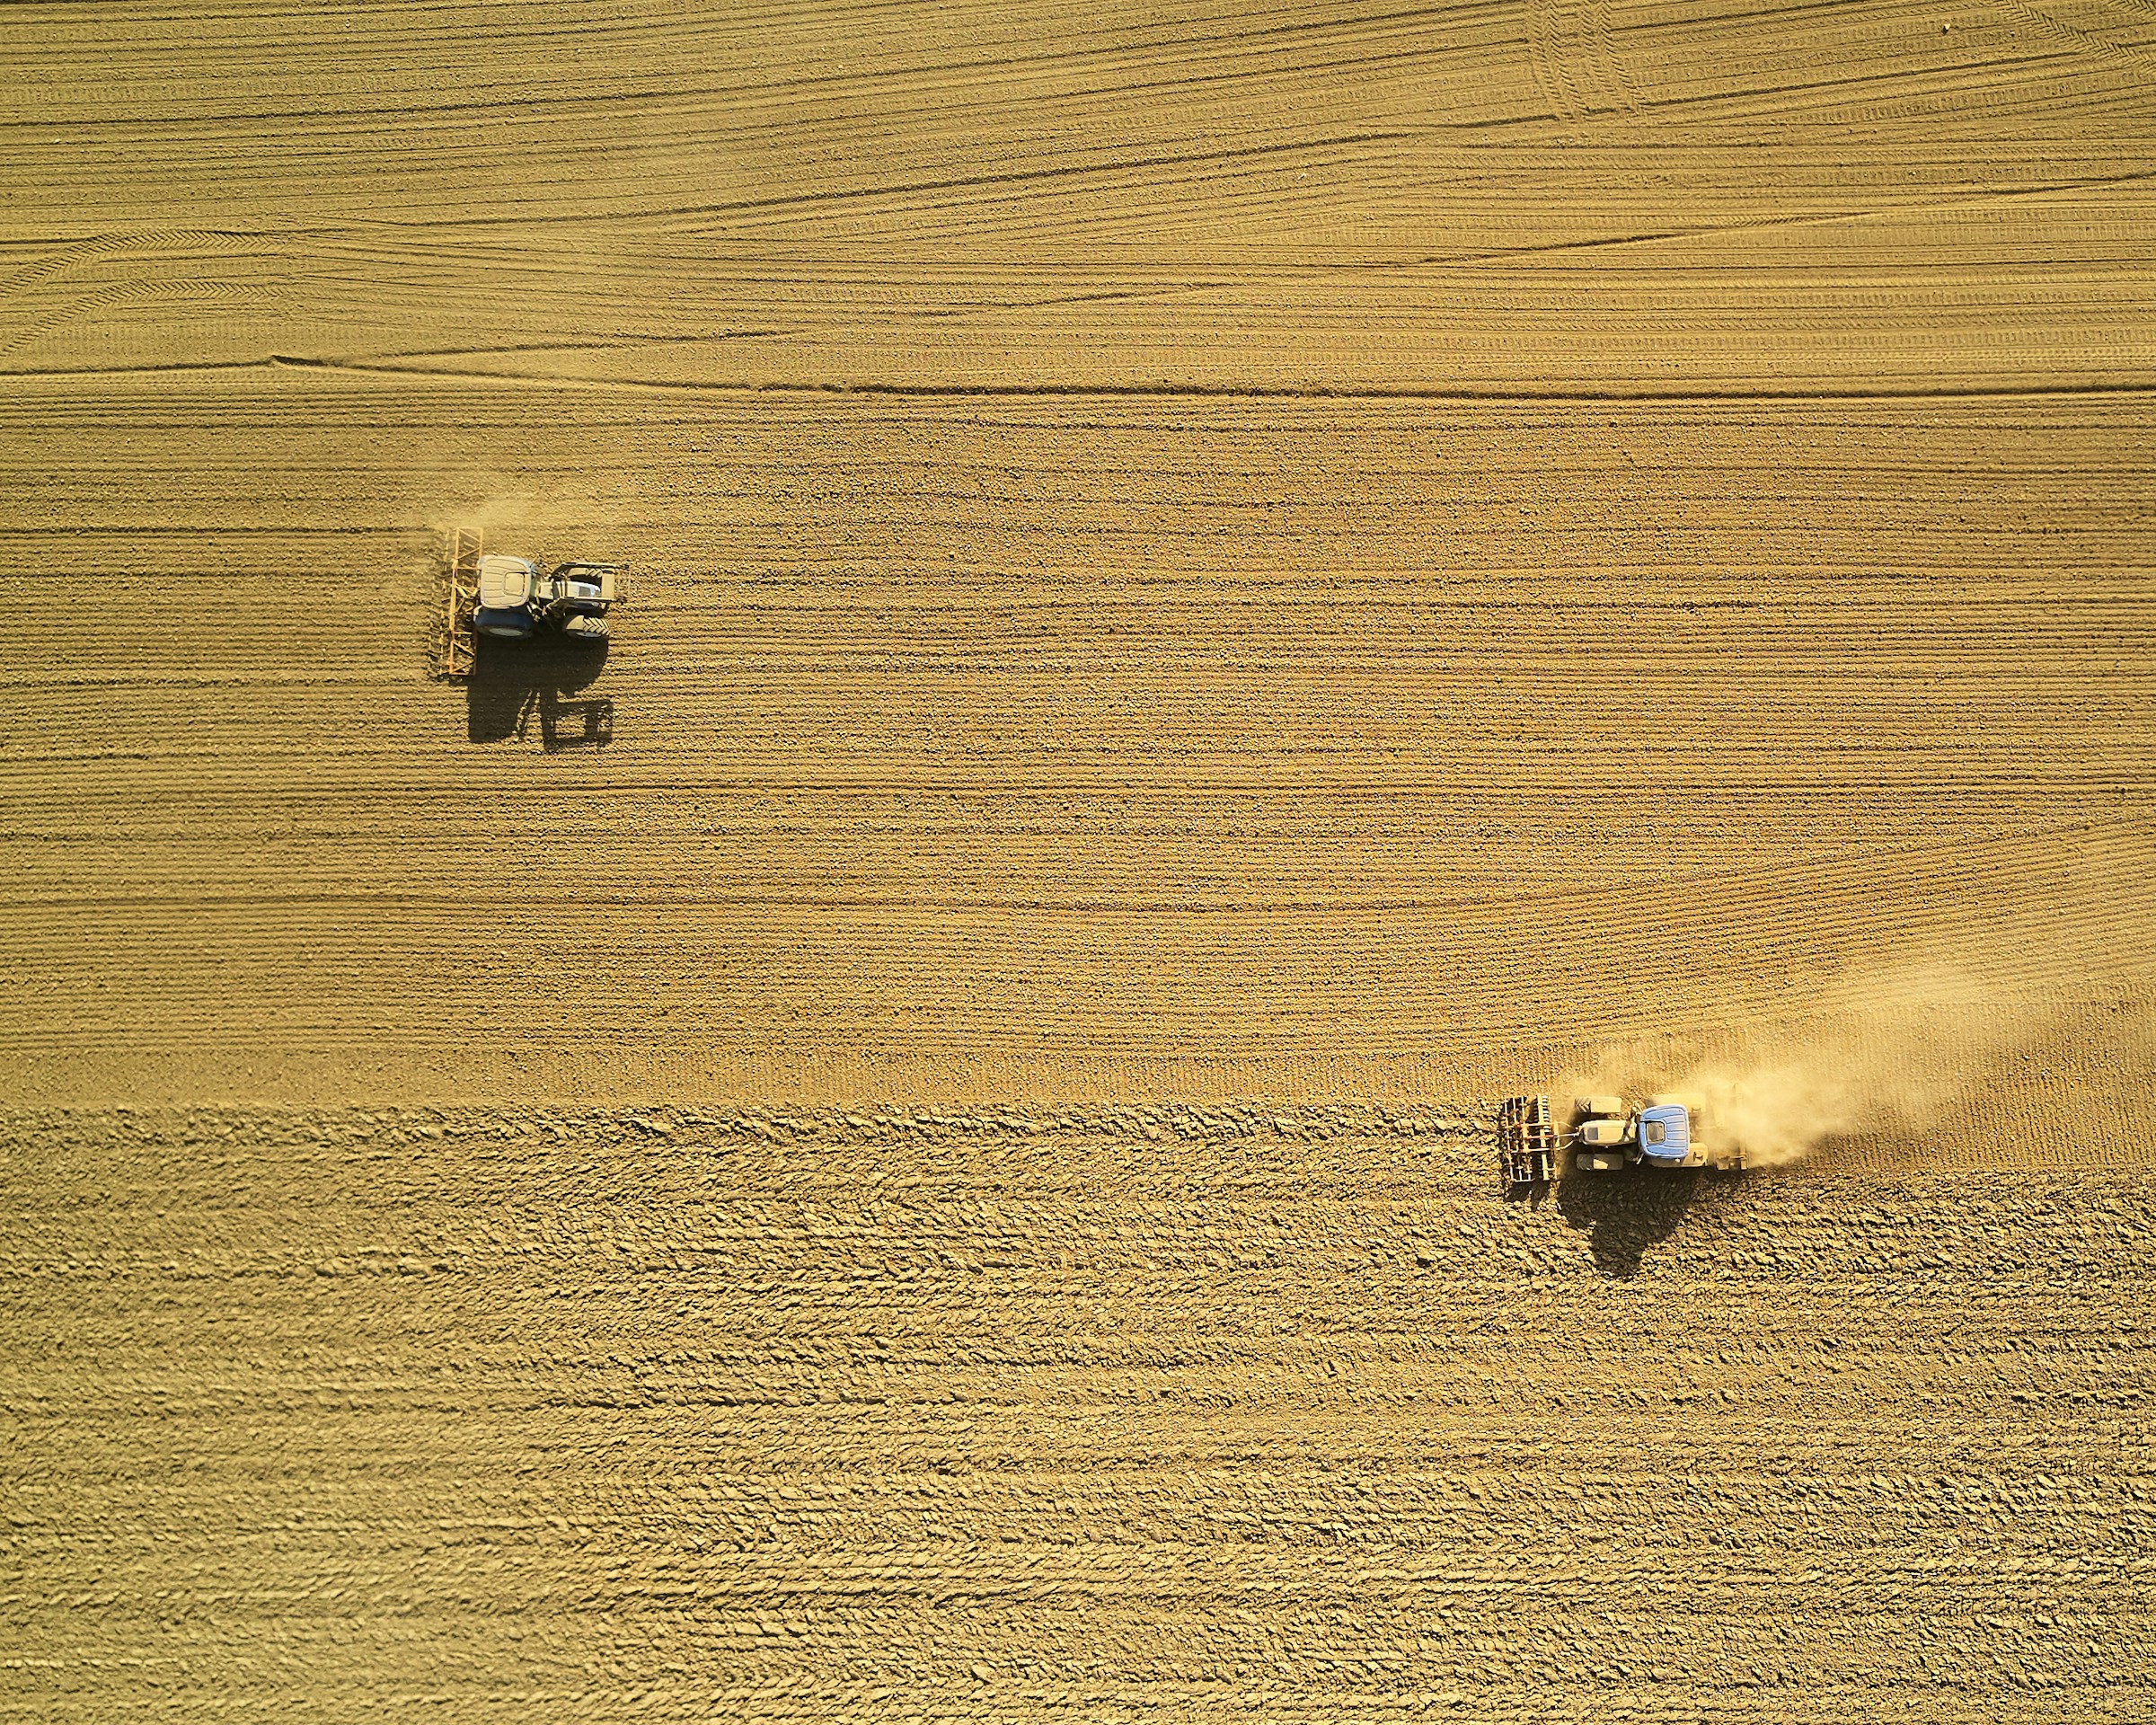
On meat: Purchases of raw carcase meat have been on a downward trend since 2009, falling by 7.7 per cent. Beef, which accounts for around half of raw carcase meat purchases, showed a downward trend, declining by 6.8 per cent on 2009. All types of beef generally show a fall in purchases since 2009, except minced beef, which shows a long term upward trend despite a marked fall of 11 per cent between 2011 and 2012. Purchases of pork are relatively unchanged and lamb, whilst 22 per cent down on 2009, shows no clear statistical trend over that period. Purchases of non-carcase meat and meat products have been relatively stable since 2009, increasing by 0.8 per cent since then. Most cooked and canned meat categories show downward trends. Purchases of uncooked chicken have generally been rising since 2005 and are up by 5.1 per cent from 2009, although this is not a statistically significant trend. Purchases of meat based ready meals and convenience meat products are on an upward trend with a rise of 8.2 per cent between 2009 and 2012.
You can download the full report here.

Comments (0)