1. Introduction
2. How are diets and lifestyles changing today?
2.1 Current trends in diet and lifestyle
2.2 The nutrition transition: five patterns of diet and activity
2.3 Criticisms and qualifications of the nutrition transition model
3. Health implications
4. Environmental implications
As countries and societies become, on average, wealthier, more urbanised and more open to global trade, people’s diets and lifestyles change. Nowadays, the most widespread transition is the set of changes that accompanies countries becoming more wealthy and industrialised: moving towards an abundance of fatty, sugary foods and more highly processed foods, along with lifestyles becoming more sedentary in work, at home, and during travel and leisure. These changes in diets and lifestyles have been described by a model called the “nutrition transition,” and they have implications for both health and environmental sustainability.
High-income countries generally began a shift towards diets high in oils, sugar and processed food around the time of the industrial revolution (starting in the late nineteenth century),. Most low- and middle-income countries, in contrast, didn’t begin that dietary shift until the 1980s to 1990s,. Meanwhile, physical activity has been declining over the past few decades in many countries, including the United States, Brazil and China.
These changes in diets and lifestyles are driven by several interlinked factors, including the process of urbanisation, increases in average per capita incomes, the growth of supermarkets, market liberalisation, foreign direct investment, and food marketing. These factors are discussed in turn below.
Urbanisation
Globally, the percentage of people living in urban areas has increased from 34% in 1960 to 55% in 2017 (32% in low income countries, 52% in middle income countries and 82% in high income countries).
Urbanisation affects diet and lifestyle in several ways, which together can influence health outcomes.
Lifestyles in urban areas tend to be less physically active than in rural areas. Factors that are particularly relevant in urban areas of lower income countries include:
- Urban jobs tend to be less physically strenuous than rural jobs (however, even in rural areas, modern transportation, cheap tractors and other technology have significantly reduced work effort,)
- Less energy is expended on household chores because of easier access to piped water, electricity, refrigeration, cooking appliances, etc., and
- There is greater reliance on motorised transport.
People in urban areas in the so-called developing world have experienced faster dietary change than in rural areas. Contributing factors include:
- Urban residents tend to have a different socioeconomic profile to rural residents
- Urban areas often have a greater choice of food at lower prices
- Urban areas provide physical proximity to supermarkets and the types of foods they stock (often processed), and
- Access to technologies such as refrigeration and microwaves influences diets and lifestyle.
As an example of the dietary differences between urban and rural areas, in urban areas of China, consumption of processed food is rising more quickly and consumption of beef and mutton is now higher than in rural areas.
Increases in per capita incomes
Increasing per capita incomes can mean that people have more money with which to buy different foods. For example, in Western Europe in the nineteenth and early twentieth centuries, rising incomes led to the replacement of bread and potatoes with more meat, dairy, sugar, fruit, vegetables and oils, while in modern-day China, higher incomes are associated with greater food intake in most food categories.
Rise of supermarkets
Food purchases from supermarkets and large grocery stores are growing globally. For example, in Latin America in 1990, only 10% to 20% of purchases came from grocery stores; by 2000, around 50% to 60% of food was bought in supermarkets. In this century, this same rapid change is occurring throughout all of Asia and Africa, with speedier change in urban areas.
Liberalised markets
Economic liberalisation refers to the process of loosening government restrictions on markets and international trade, e.g. removing tariffs on imports, facilitating foreign investment, or the privatisation of industries previously owned or controlled by governments. It is not fully understood how economic liberalisation affects food supply and diet, because it impacts upon many interlinked factors, some of which work in opposite directions.
For example, countries tend to rely more on food imports and less on locally grown, seasonal products as their economies become more liberalised, in part due to policies that make trade easier and cheaper, such as lower tariffs on imports. These changes can lead to greater availability of imported food including fatty and sugary foods and animal feed, which in turn can contribute to greater variety in diets, higher animal product consumption, less seasonal variation in the composition of diets and higher consumption of processed foods.
On the other hand, some governments may also choose to encourage exports through currency devaluation, which can make imported food more expensive.
Foreign direct investment
Foreign direct investment (FDI) refers to investors from one country buying or establishing assets in another country, where the investors retain control over the assets,. FDI has made processed foods more available in lower income countries, because the investment can increase local production of processed foods, because multinational food retailers may prefer to stock processed foods with a long shelf life20, and because of increased investment in marketing and advertising of food.
Food marketing
Food marketing influences consumption patterns and, in particular, can stimulate consumption of food types that generate a high profit margin for manufacturers or retailers. According to Hawkes, “[P]romotions for energy-dense, highly-processed foods aggressively target young people, aiming to influence food consumption patterns that will carry into adulthood,” and indeed studies have shown that advertising - particularly via television - of foods high in salt, sugar or fat influences the purchase decisions of children and their parents.
The ‘nutrition transition’ model was developed by researcher Barry Popkin in 1993. He used this model to describe five patterns of diet and lifestyle, based on the changes outlined above,,:
Stage 1: Hunter-gatherer lifestyles.
Stage 2: Early labour-intensive agriculture with periods of famine.
Stage 3: Receding famine as agriculture becomes more industrialised and incomes rise.
Stage 4: “Western”-style diets high in calories, sugar, animal fat and processed foods, and sedentary lifestyles.
Stage 5: Healthier diets and more active lifestyles.
These five patterns do not refer to specific historical periods - rather, each stage can occur at different times in different places. Furthermore, different subpopulations within one country, such as richer or poorer people, might be experiencing different stages of the nutrition transition. The stages should be seen as general guides and may not reflect real-life trends precisely.
The term nutrition transition is commonly used by researchers to refer to the shift from Stage 3 to Stage 4, i.e. the change away from traditional diets towards foods higher in fats, meats and sugar, and the rise in sedentary lifestyles as countries become more industrialised.
Lang and Rayner propose that the nutrition transition should be viewed not as one but as three overlapping transitions - in diet, physical environment, and culture - and that all three need to be tackled for obesity policies to be effective. Furthermore, as section 3 below discusses, the disease risk factors associated with the nutrition transition do not necessarily change simultaneously or at the same rate.
Hawkes suggests that the nutrition transition model should not be thought of as a global convergence to one type of diet. She points out that some case studies have shown “both convergent and divergent dietary outcomes” of globalisation. This means that while diets do tend to converge in that they become higher in processed foods, the types, brands and marketing techniques of these foods are divergent in that they are customised to different people and places. For example, Frito-Lay popularised potato chips in Thailand, but developed new flavours specifically to appeal to the Thai market, while fast-food chain McDonald’s developed a menu to suit the Indian market, with many vegetarian options and no beef or pork.
The nutrition transition model assumes that countries will follow roughly the same social, technological and economic pathway, moving from the earlier to the later stages of the model. However, some thinkers have criticised the assumption that currently lower-income countries will necessarily follow the same socioeconomic development pathway as today’s higher-income countries. For example, Wade argues that some international trade deals will prevent low-income countries from using the same developmental strategies – such as protection of domestic industries - that have been used by some higher-income countries.
Several other aspects of the nutrition transition model have been criticised as overly simplistic. For example, Stage 1 does not mention seasonal food shortages - as such, it could be regarded as an idealised view of hunter-gatherer societies (although Berbesque et al. report that warm-climate hunter-gatherer societies had less frequent famine than agricultural societies across several measures). To take another example, the nutrition transition model proposes that the onset of agriculture (Stage 2) caused shorter average statures due to less diverse diets, but Mummert et al. propose that the cause may have been the greater spread of infectious diseases due to a more densely packed population (some diseases can inhibit the body’s ability to absorb and retain nutrients from food – see What is malnutrition? for more details).
Studies of the nutrition transition often use proxies (such as body weight or food availability) for changing diets rather than data on the changing diets themselves. Walls et al. argue that standard instruments for measuring diets are not adequate to reflect the nutrition transition, because some highly processed foods are included in the same category as relatively unprocessed foods.
Stage 5 to date remains largely hypothetical, since widespread behavioural and/or institutional changes towards healthier lifestyles have not yet occurred in any country.
That said, there are some signs of moves towards healthier lifestyles in some respects among some subsets of the global population. Consumption of salt, sugar and fat from processed food has levelled off in a few high-income countries such as Japan and Singapore (driven at least partly by slowly declining consumption of processed food),, and some governments have introduced policies to improve diets, such as taxes on sugar-sweetened beverages and regulations on food marketing. Meanwhile, in richer countries, people with higher socio-economic status tend to have a lower body mass index (in contrast to poorer countries, where people with higher socio-economic status tend to have a higher body mass index).
However, Figure 2.3 of the 2017 Global Nutrition Report shows that no countries have made progress in tackling obesity, while Popkin16 states that “no country has truly attempted to create programmes to significantly reduce animal-source food consumption”.
The nutrition transition (i.e. Stage 3 to Stage 4) is generally associated with a decrease in diseases that are caused by hunger or insufficient access to nutritious food (see the building blocks What is malnutrition? and What is food security?). However, the transition also brings with it an increase in non-communicable diseases associated with sedentary lifestyles and excessive intake of overall calories or specific food components such as sugar or fat. Between 2010 and 2014, the proportion of adults who are overweight, obese or have elevated blood glucose levels (a risk factor for diabetes) rose in every area of the world.
In China, for example, although there have been large reductions in undernutrition and micronutrient deficiencies over the last two decades, non-communicable diseases associated with lifestyle and diet are now also emerging. Diabetes and pre-diabetes are widespread, with diabetes being more common in urban than in rural areas. The process of urbanisation has also been associated with higher blood pressure and obesity, as well as diabetes, in various other countries.
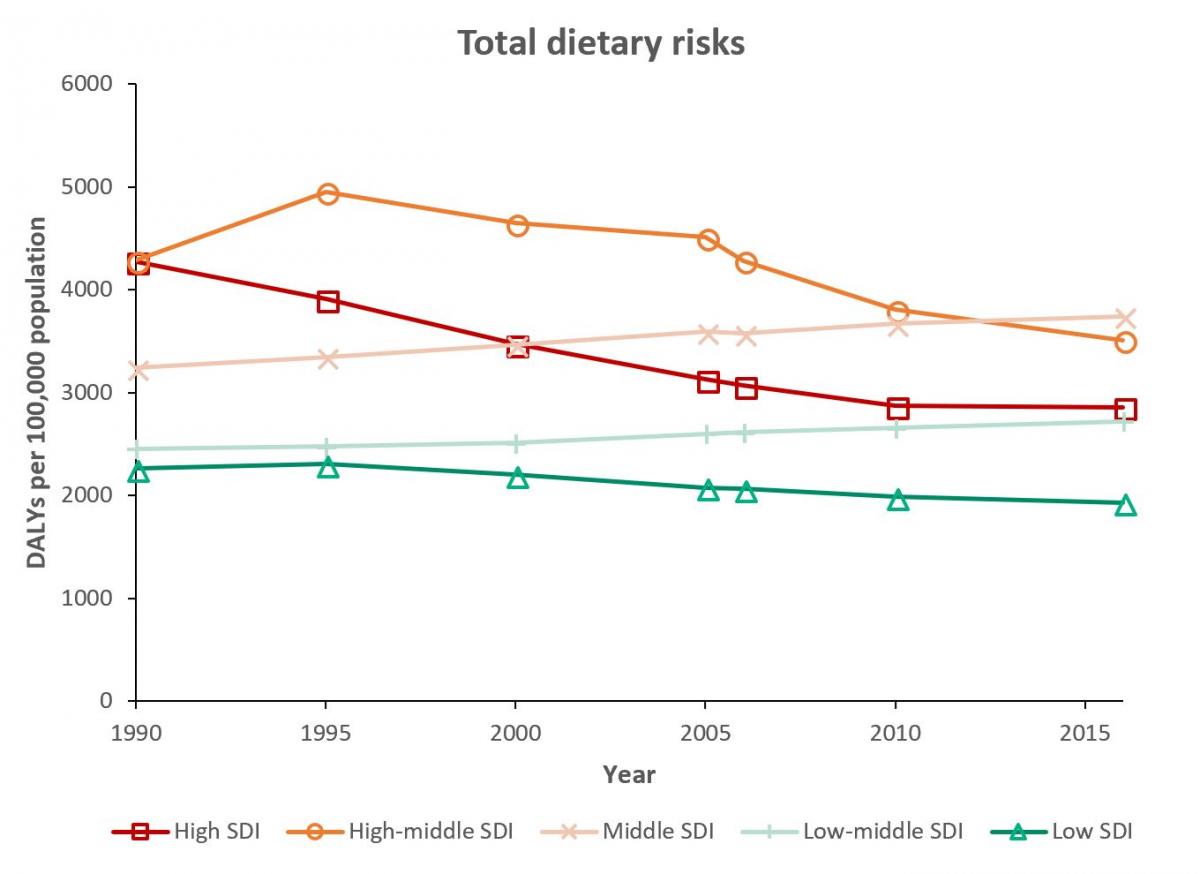
Figures 1 to 5, below, show trends in the disease burden attributable to several different dietary and lifestyle risks. The disease burden is measured here in DALYs (disability-adjusted life years) per 100,000 population, per year. One DALY refers to one year of good health that has been lost, weighted according to the severity of the condition. DALY rates are further broken down by socio-demographic index (SDI), a composite measure of development. Higher SDI is defined as higher income per capita, higher educational attainment and a lower total fertility rate. Countries with a high SDI include the US, the UK and Australia; countries with a middle SDI include Brazil, India and China; countries with a low SDI include Afghanistan, the Democratic Republic of the Congo and Ethiopia.
Figure 1: Rates of DALYs attributed to total dietary risks (which includes diets low in fruits, vegetables, legumes, whole grains, nuts and seeds, milk, fibre, calcium, seafood omega-3 fatty acids, polyunsaturated fatty acid, and diets high in red meat, processed meat, sugar-sweetened beverages, trans fatty acids and sodium). SDI refers to socio-demographic index, a composite measure of development; higher SDI means higher income per capita, higher educational attainment and lower total fertility rate. Data source: GBD Compare. Figure produced by the Food Climate Research Network.
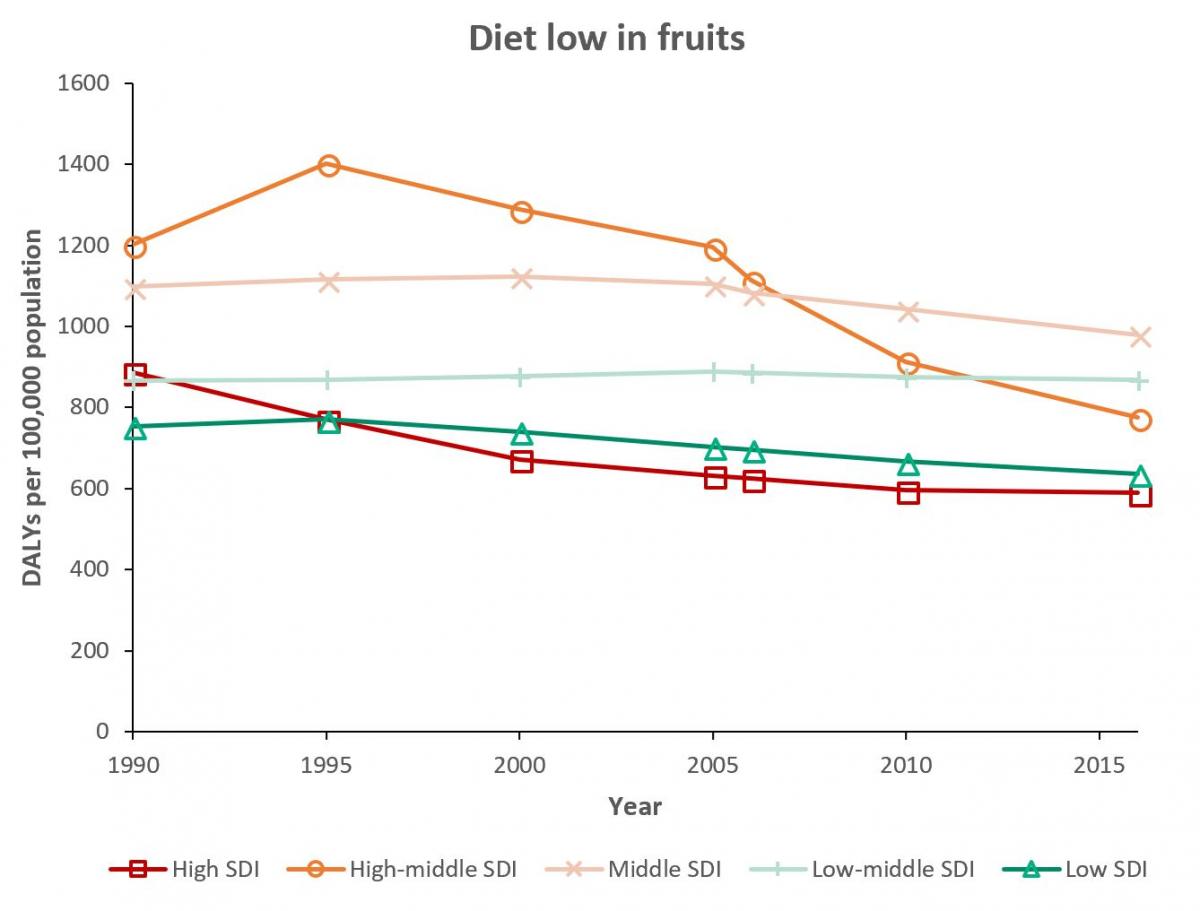
Figure 2: Rate of DALYs attributable to a diet low in fruits. Data source: GBD Compare. Figure produced by the Food Climate Research Network.
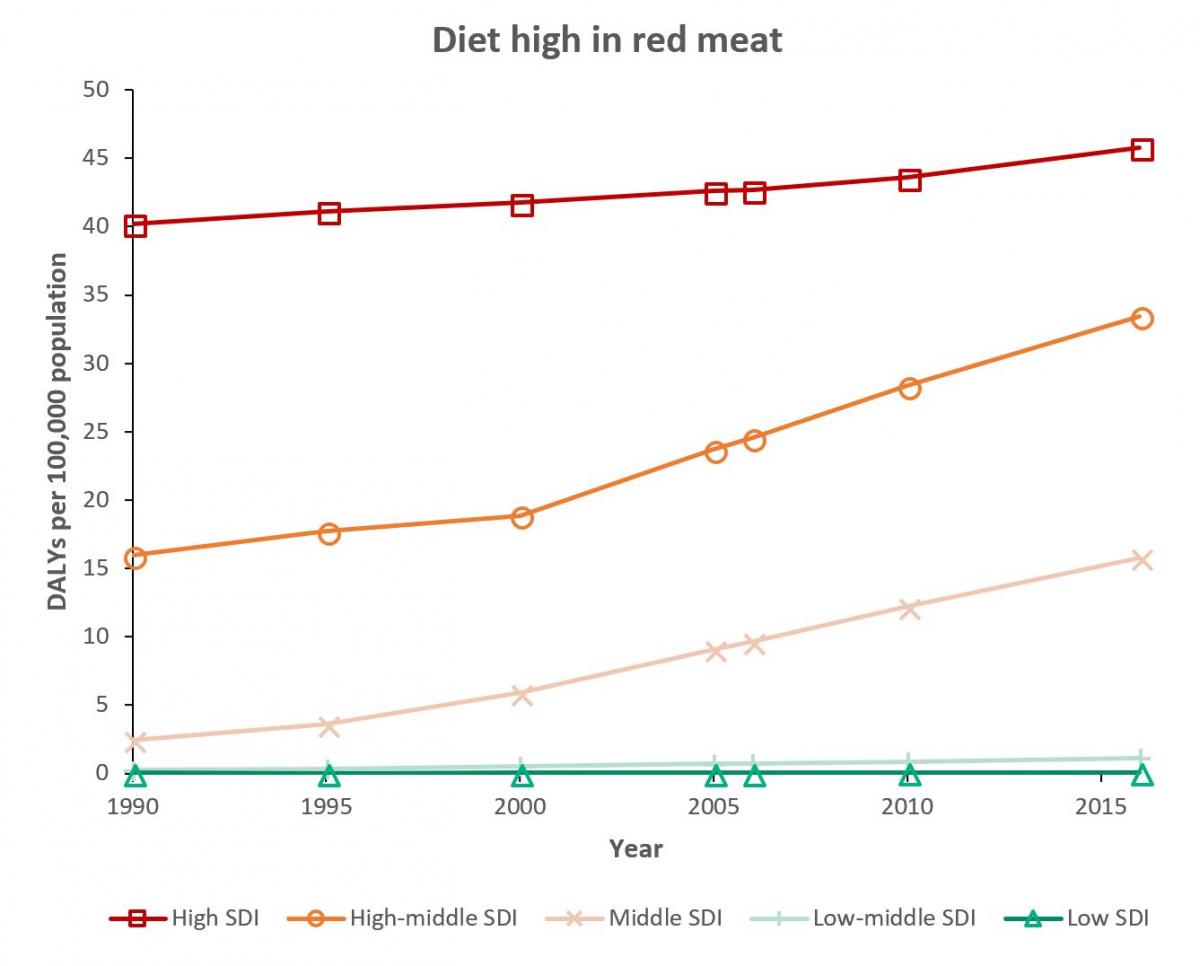
Figure 3: Rate of DALYs attributable to a diet high in red meat. Data source: GBD Compare. Figure produced by the Food Climate Research Network.
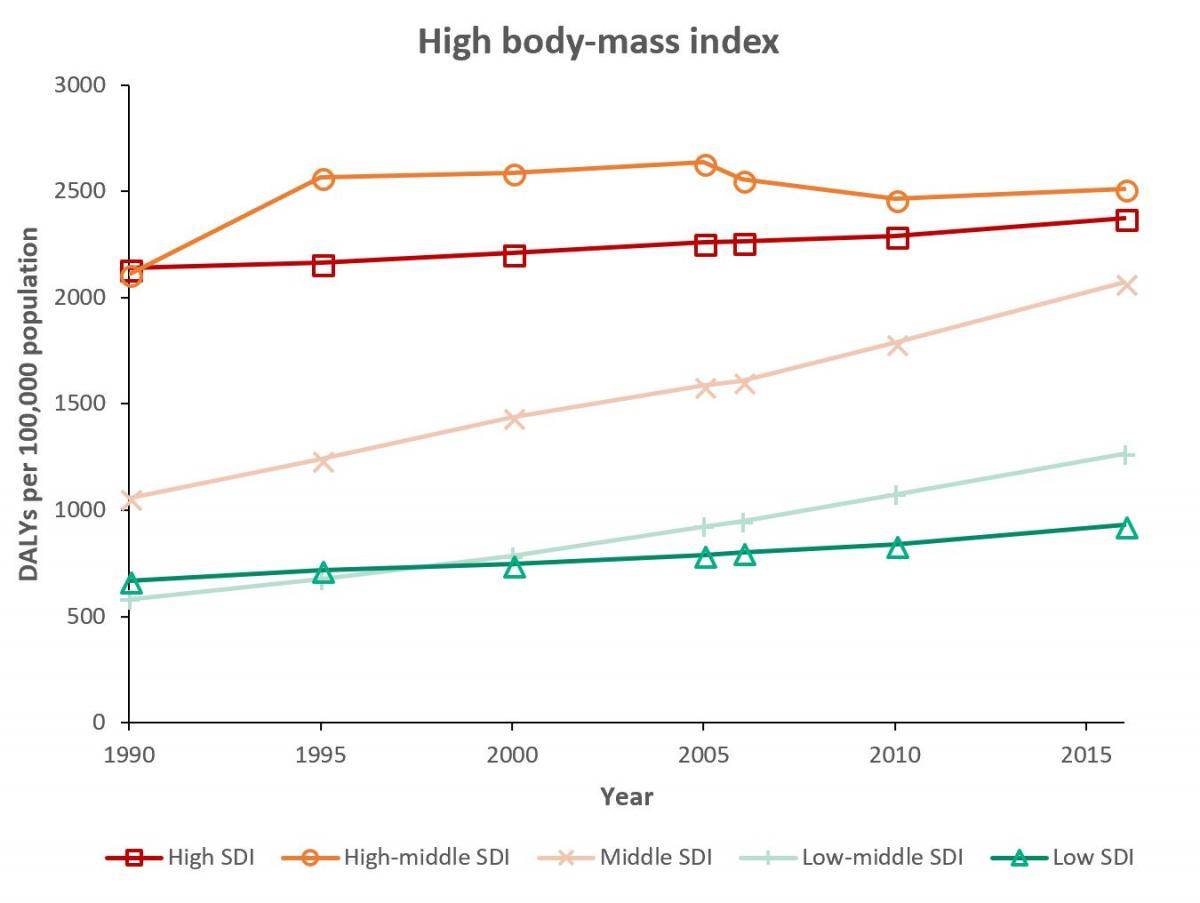
Figure 4: Rate of DALYs attributable to high body-mass index (BMI) (higher than 21.0-23.0 kg/m²; note that this includes some people who are not classed as overweight or obese, as the lower BMI limit for overweight is 25 kg/m2). Data source: GBD Compare. Figure produced by the Food Climate Research Network.
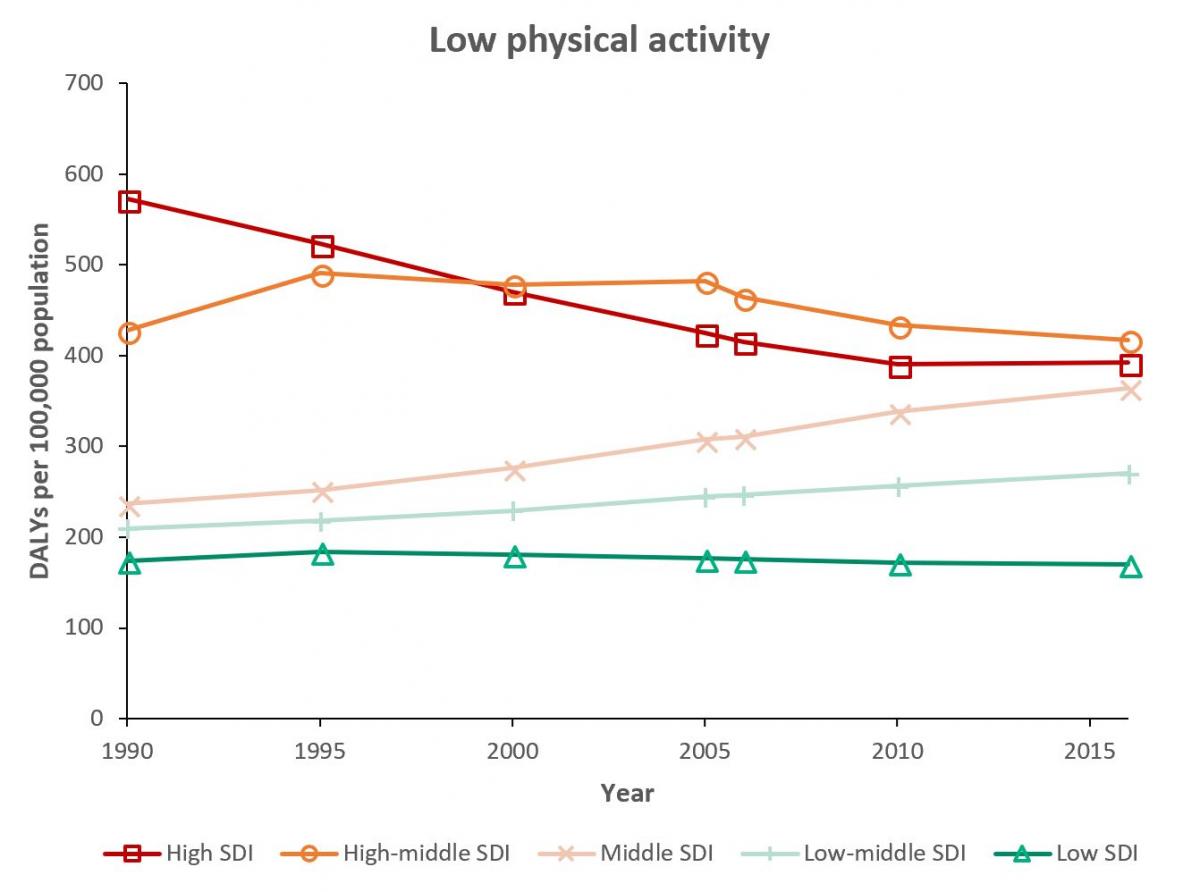
Figure 5: Rate of DALYs attributable to low physical activity. Data source: GBD Compare. Figure produced by the Food Climate Research Network.
The trends shown in the figures above could be due to factors other than diet and lifestyle, such as changes in healthcare provision. Nevertheless, for some risk factors, the patterns appear to follow the trends predicted by the nutrition transition model. Disease burdens from these specific risks are low in the lowest SDI regions (Stage 2 to 3), then increase with higher SDI (Stage 4), followed by (only for some risk factors) a reduction in disease burden for the highest SDI regions (Stage 5).
Specifically, disease rates from total dietary risks (Figure 1), diet low in fruits (Figure 2) and low physical activity (Figure 5) are declining in the highest SDI regions. However, disease rates due to red meat consumption (Figure 3) and high body-mass index (Figure 4) continue to climb in even the highest SDI regions.
These trends suggest that the factors associated with the nutrition transition model do not all go through the same transition simultaneously or at the same rate.
To view trends of disease associated with different risk factors in more detail, visit GBD Compare. See the Further Resources section, below, for instructions.
There is limited research on the environmental impacts of the nutrition transition, particularly regarding heavily processed and packaged foods. However, the fact that consumption of animal products remains high in high-income countries and is increasing in low- and middle-income countries has implications for greenhouse gas emissions, land use, water use and other environmental concerns.
Gill et al. examined the environmental consequences of the nutrition transition in Brazil, India and China between 1961 and 2011 by assessing changing food supplies in each country (i.e. amount produced plus imports minus exports). Supplies of vegetable oil rose in all three countries, causing an increase in land use; higher supplies of cereals in China and India affected nitrogen and phosphorus cycles; and higher beef supplies in Brazil led to high carbon and water footprints.


Comments (0)