
This study published in the Proceedings of the National Academy of Sciences (PNAS), has an interesting approach to capturing changes in diets by country. It uses an ecological metric – trophic levels – to calculate different dietary patterns across different countries and to examine how these patterns - and their trophic levels – have changed over time (1961-2009).
The study reveals that globally, humans have a Human Trophic Level (HTL) of 2.21, which is the same trophic level of pigs and anchoveta. In cross country comparisons, despite finding that national HTLs range between 2.04 and 2.57 reflecting a broad diversity of diets, there is a clustering of countries which breaks nations into five broad diet-groups.
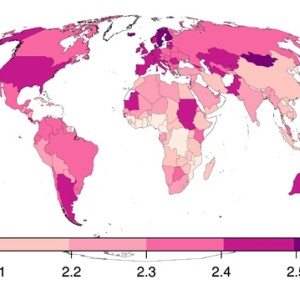
The image below shows one of the figures in the paper, a country-by-country breakdown of the median human trophic level, showing humans' place in the global food chain on a scale that goes from 1 (organisms such as plants that get their energy from the Sun) to 5.5 (top predators such as polar bears or orcas).

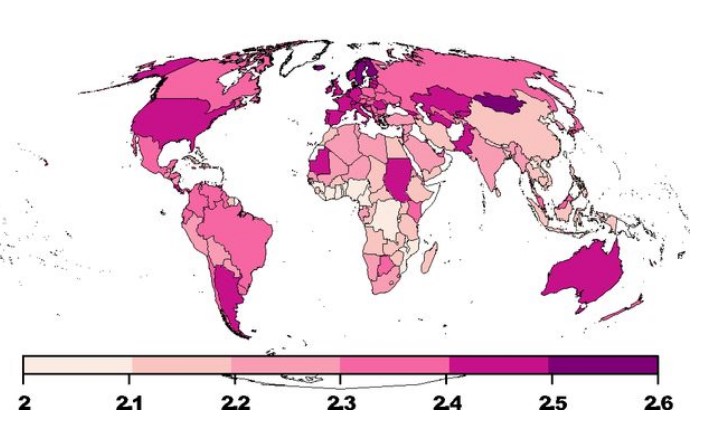
The study finds that two groups of countries have stable HTLs over the study period, two significantly increase, and one significantly decreases. The majority of sub-Saharan countries and most of Southeast Asia have a pattern of low and stable HTL (group 1), reflecting diets that are primarily plant based . Low and increasing HTLs are found for several countries throughout Asia, Africa, and South America, including China and India (group 2). Group 3, including Central America, Brazil, Chile, Southern Europe, several African countries, and Japan, has higher initial HTLs than group 2 and also shows an increasing trend. Increasing HTLs in groups 2 and 3 indicate diets that are shifting toward higher consumption of animals. Group 4, comprised of North America, Northern and Eastern Europe, Australia, and New Zealand, had high and stable HTLs until 1990, when they begin to decrease. Group 5 represents countries with the highest overall HTLs and decreasing trends, including Iceland, Scandinavia, Mongolia, and Mauritania. Traditional diets of this group were composed of meat, fish, or dairy products and low vegetable consumption.
The study also finds that HTL is positively related to, for example, gross domestic product, life expectancy, CO2 emissions, and urbanization rate until a point after which the relationships plateau and then turn negative. It doesn’t discuss why this might be the case although – if you have any views please let us know by posting your comments below this newsletter article on the website or in the forums (the later requires you to be signed in as a member). You can also e-mail Tara Garnett directly, taragarnett(at)fcrn.org.uk.
The citation and abstract are as follows:
Bonhommeau, S. Dubroca L., Le Pape O., Barde J., Kaplan D. M., Chassot E., Nieblas A-E., 2013, Eating up the world’s food web and the human trophic level, Proc. Natl Acad. Sci.
Abstract
Trophic levels are critical for synthesizing species’ diets, depicting energy pathways, understanding food web dynamics and ecosystem functioning, and monitoring ecosystem health. Specifically, trophic levels describe the position of species in a food web, from primary producers to apex predators (range, 1–5). Small differences in trophic level can reflect large differences in diet. Although trophic levels are among the most basic information collected for animals in ecosystems, a human trophic level (HTL) has never been defined. Here, we find a global HTL of 2.21, i.e., the trophic level of anchoveta. This value has increased with time, consistent with the global trend toward diets higher in meat. National HTLs ranging between 2.04 and 2.57 reflect a broad diversity of diet, although cluster analysis of countries with similar dietary trends reveals only five major groups. We find significant links between socio-economic and environmental indicators and global dietary trends. We demonstrate that the HTL is a synthetic index to monitor human diets and provides a baseline to compare diets between countries.
To access the article in PNAS, click here. Supplementary information for the study can be found here.
You can also read a piece in the journal Nature discussing the findings of the study here.
This paper is in keeping with other studies that highlight the emissions and resource intensity of diets high in animal products. For example the FAO in its most recent assessment calculates that the livestock sector contributes to 14.5% of global GHG emissions.
There are summaries of and links to many other resources looking at diets, consumption and environmental impacts on the FCRN website. For example try searching the consumption section of our research library here or the meat one here. You can also access other resources linked to animal-based diets here. For FCRN publications focusing on livestock and consumption see here.


Post a new comment »