
Journal articles
Global food nutrients analysis reveals alarming gaps and daunting challenges
This paper quantifies the availability of two macronutrients and nine micronutrients for 156 countries in ‘available food’, which they define as the quantity of food produced that is potentially available for consumption after factoring in reductions arising from food loss and waste, and non-food use through the production chain. Nutrient availability is assessed against a range of dietary guidelines to determine the depth and breadth of nutrient deficiencies across regions and countries, and a series of intervention strategies are explored.

Summary
Global food outputs have increased rapidly over the 20th century to match population growth, but only recently has research found ‘hidden hunger’ emerging because of widespread nutrient deficiencies. This paper extends research into global malnutrition first by assessing availability of a widened range of nutrients including calories, protein and nine micronutrients (five vitamins: vitamin C, vitamin A, vitamin B3, vitamin B6 and vitamin B12; four minerals: iron, zinc, calcium and magnesium) and second by more accurately taking into account actual food availability, by accounting for food loss and waste (FLW) and non-food use. This is done through constructing a food production–consumption–nutrition (food-PCN) model to track food material flow through the agrifood system. This model was constructed through a literature search for existing data that established measurements for loss-related reductions in total food volume, such as processing waste (wheat milling, rice threshing, maize shelling, root-crop processing, vegetable peeling, fruit pitting or peeling etc.). Such losses have previously not been accounted for in the literature and as a result the researchers found there to be substantially lower food-based nutrient availability than reported in previous studies.
Overall it was found that of global food production (7,507 Mt in 2017) 35% went to non-food use, 22% was lost or wasted and 43% remained available for human consumption (see below). This leaves 1,221 g of food per capita per day available globally, which is unevenly distributed: the highest availability is in North America (1,805 g) and the lowest in Sub-Saharan Africa (852 g). Despite this, macronutrient availability (calories and protein) was adequate or surplus to recommended nutrient intakes (RNI) (1.15x RNI for calories and 1.39x for protein) in all regions including SSA, determining that global food production capacity is sufficient to meet projected protein-energy requirements in 2050 . This remained true at regional level with five regions having a protein surplus and two a calorie surplus (Europe and North America had both).
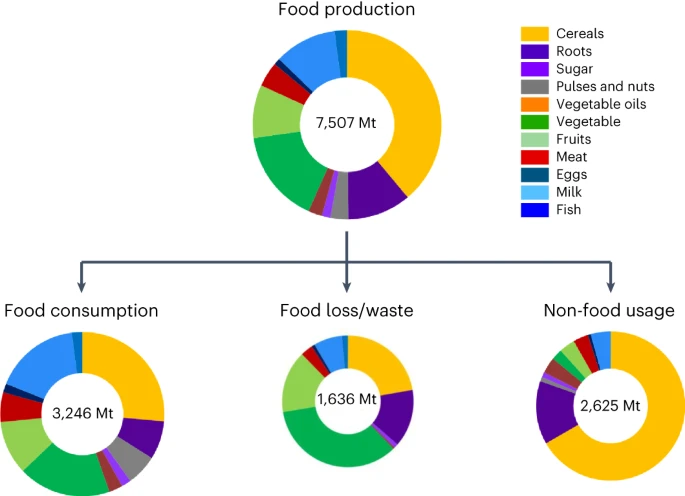
Fig. 1: Global food production, food loss/waste, non-food usage and available human consumption (Wang et. al., 2023)
In order to assess micronutrient availability the researchers set parameters for nutrient availability and discussed these at regional and national levels. The five parameters were defined by the authors as: severe deficit (intake ratio, <0.60; that is, calculated food nutrient availability is <60% of RNI), moderate deficit (0.60–0.80), mild deficit (0.80–0.90), near-adequate or adequate (0.90–1.30), and surplus (>1.30).
Globally, they found a severe deficit of food available vitamin A (intake ratio, 0.50) and calcium (0.54) with moderate deficits of vitamin B12 (0.76). Five micronutrients (vitamin C, vitamin B3, vitamin B6, zinc and iron) were adequate or near adequate; magnesium was in surplus. Global results can be seen in the figure below. The availability of animal-source foods was a primary contributor to the availability of many nutrients, with milk consumption in particular contributing to 29% of vitamin A, 57% of vitamin B12 and 45% of calcium (see below).
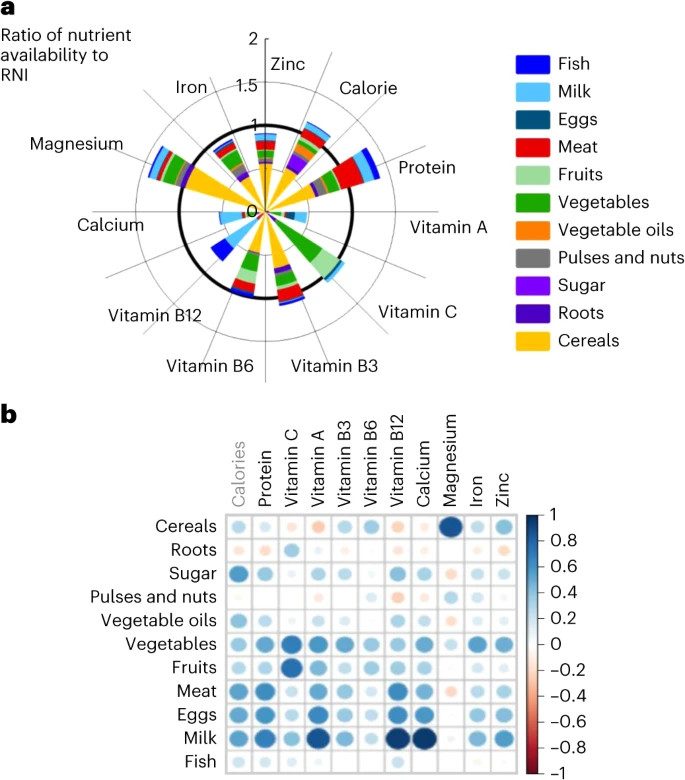
Fig 1. Global food nutrient availability status.
There was significant regional variation in both the breadth and depth of micronutrient deficiencies. Vitamin A deficiency was the greatest concern with five regions in severe deficit and the remaining three in moderate deficit. Calcium availability was in moderate to severe deficit in six regions; vitamin B12 showed severe deficit in four regions. Out of all eight regions, Sub-Saharan Africa was the lowest in micronutrient availability with severe deficits in vitamin A, calcium and vitamin B12. There were also moderate deficits in zinc, iron and vitamin C in three regions. In contrast, North America and Europe were found to have adequate micronutrient availability for all except vitamin A, which was found to be moderately deficient.
At the country level, 90 countries were deficient in all micronutrients. Among the three micronutrients with the greatest deficiency, (1) severe, moderate or mild deficit of vitamin A occurred in 72%, 15% and 8%, respectively, of the 156 countries; (2) calcium showed severe, moderate or mild deficit in 67%, 13% and 5%, respectively, of the countries; 14 countries were adequate for calcium, all in developed economies with high milk consumption; (3) for vitamin B12, 48%, 13% and 4% of the countries had severe, moderate or mild deficiency, respectively. The researchers compared micronutrient availability with economic status and found that whilst GDP per capita was positively correlated with the availability of animal-source foods, the availability of plant based foods was largely influenced by food habits and culture. The authors give the following example; East Asian populations are known for favouring vegetables, and this is reflected in the data with East Asian diets containing 2.7–7.6 times more vegetables than diets in all other regions. Furthermore, for the three micronutrients with the highest deficits (vitamin A, calcium and vitamin B12), nearly all low-income countries had severe or moderate deficits; but for high-income countries, the deficits were less severe.
The researchers then developed an algorithm to formulate optimal diets that met the amounts of all nutrients contained in global diets RNI targets. They found that diets would require an increase per capita availability of fruit, vegetables, milk, eggs, fish and seafood, and pulses and nuts by 56–567% compared with the current global bassline diet, while reducing cereals and meats by 27% and 38% (see fig. 3 Global bassline vs. Optimal diet). They then included a series of modelled interventions to see how these could close the gap between bassline and optimal diets. The interventions explored were (1) reduction in FLW and maximisation of food-processing efficiency (2) biofortification of crops with micronutrients (3) global dietary supplementation of vitamin A and calcium to fulfil 10% of nutrient requirements. The results of these interventions improved bassline diets, but not significantly (see fig 3. adjusted optimal diet), with diets still more closely resembling bassline than optimal nutrition.
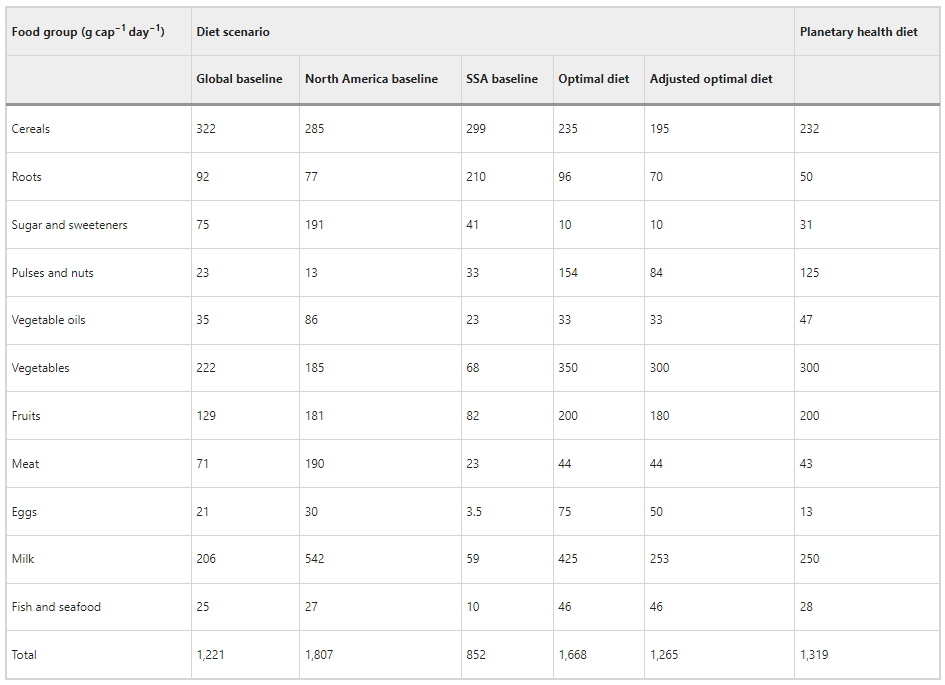
Fig. 3 Comparison of baseline diets as estimated in this study with diets based on balancing all 11 essential nutrients as well as the ‘planetary health diet’
The researchers conclude that their findings of severe and widespread micronutrient deficiencies should act as a wake up call to public health professionals, policymakers and stakeholders. They conclude that action is needed on many fronts. Researchers need to adopt a new approach by shifting productivity metrics from yield (quantity) to ‘nutrients-and-yields’ (quality and quantity). They offer suggestions for accelerating the interventions modelled, including: leveraging ‘Omics’ technologies to bring about transformative changes by engineering food crops to enrich their micronutrient content; soil and agronomy research to accelerate biofortification and enhance micronutrient levels in harvested products; creating strong circularity and nutrient security in the food system through a focus on granular data and identify how much food is being reused (or not), what remains and what obstacles are in the way of its reuse; food science research and food-processing innovation to transform these inedibles into edibles (for example extracting nutrient powders from grain processing byproducts), reducing the gap between total produced food and actually available food. Finally, they argue that enhancing the resilience of food and nutrient supply with locally based solutions should be a high priority.
The researchers highlight the limitations of their study, not least of which is that their results do not measure actual nutrient intake but assess nutrient availability based on food available for consumption. Three further limitations are outlined:
- There were limitations in the sample size and regional representativeness of FLW data
- The edible portion parameters of various foods ignored differences among varieties for the same food categories due to lack of data
- Potential differences in the nutrient content of food across regions due to climate, varieties and production methods were not accounted for.
Abstract
Eliminating both overt and hidden hunger is at the core of the global food and nutrition security agenda. Yet, the collective state of nutrition security at the population level is not known. Here we quantify food-based availability of 11 essential nutrients for 156 countries using a food production–consumption–nutrition model, followed by assessment of the nutrient availability status as a ratio of recommended intake. For the baseline year 2017, global per capita availability was adequate for calorie and protein but in severe deficit for vitamin A and calcium (intake ratios, <0.60, where 1.0 is adequate) and moderate deficit for vitamin B12 (intake ratio, 0.76). At the country level, more than half of the 156 countries were in various degrees of deficit for all nine micronutrients. Disparities across regions or countries were enormous. We explore intervention strategies from an agriculture–food system perspective and discuss the daunting challenges of addressing nutrition security broadly.
Reference
Wang, X., Dou, Z., Feng, S., Zhang, Y., Ma, L., Zou, C., Bai, Z., Lakshmanan, P., Shi, X., Liu, D. and Zhang, W., 2023. Global food nutrients analysis reveals alarming gaps and daunting challenges. Nature Food, pp.1-11.
Read the full article here and find more about malnutrition in our explainer


Comments (0)