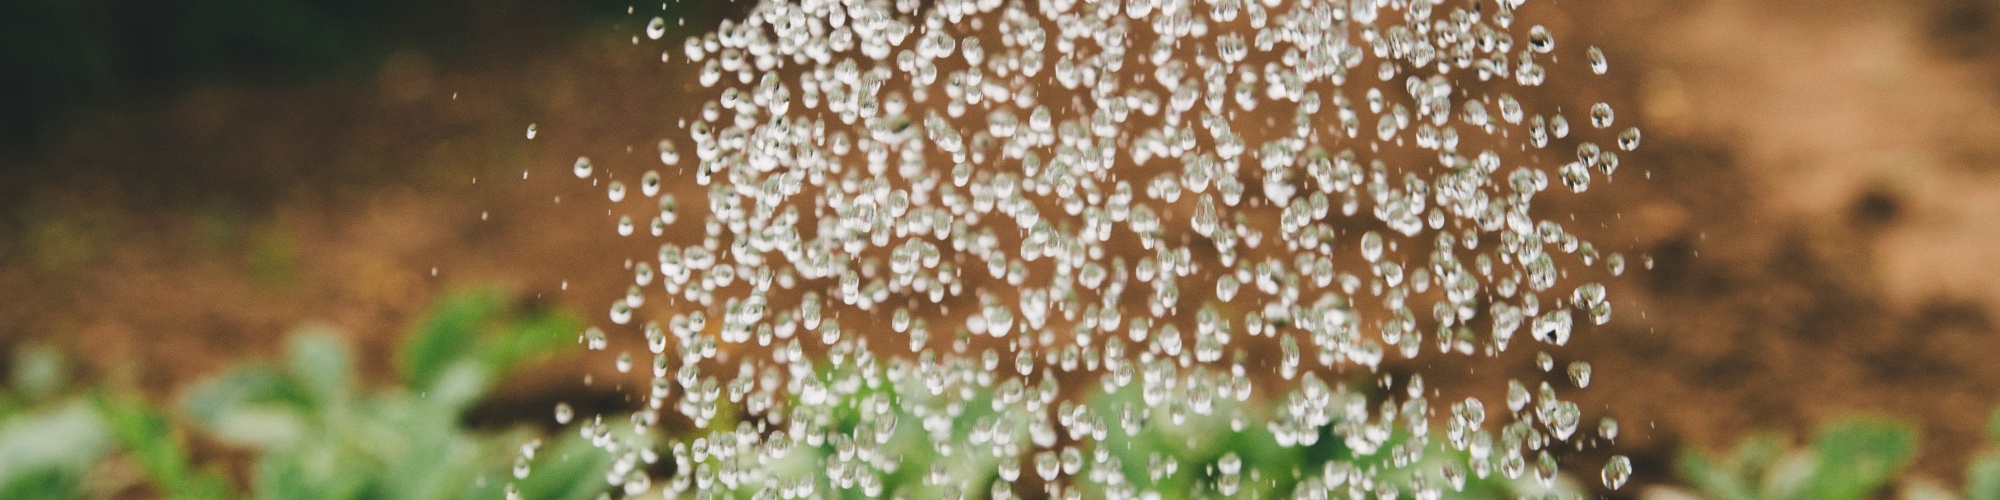
 This piece is a follow up in our new series on water. This time, FCRN member Dr Tim Hess from Cranfield University continues where Brad Ridoutt left off in his post on An update on water footprints.
Tim is an Associate Professor in Water Management at the School of Energy, Environment and Agrifood. He has over 30 years’ experience in research and consultancy in the application of hydrology in managed rural environments, particularly irrigated agriculture in the UK and overseas. This has been applied to sustainable food supply chains, working with national and international organisations and major UK retailers.


The term “water footprint” was first coined by Hoekstra and Hung in 2002 by merging the concepts of “virtual water” and “ecological footprint” to estimate the human appropriation of global water resources. In the same way that the “ecological footprint” tells us how many planets we would need to support, for example, a typical north American lifestyle, their “water footprint” told us how much of the world’s water it takes to support a particular pattern of consumption. Mapping the “water footprint” also demonstrated the dependency of nations on water consumed in other countries.
Such a volume-based assessment of the human appropriation of water is interesting and contributes to the debate on planetary limits. Mapping the “water footprint” demonstrates the dependency of nations on water consumed in other countries. It also produces numbers that are quite shocking. If you ask someone over dinner, “did you know that 7,000 litres of the world’s water have been consumed to bring the beef steak to your plate, but only 42 litres to provide the potatoes?” the answer is usually accompanied by shock (and disbelief). This provides a useful launch-point for a discussion about the sustainability of our lifestyles, but often ends up with the question “so, should we stop eating meat”?
Unfortunately the over-simplistic messages of water volumes have been widely abused to justify or encourage changes in diet and lifestyles. To answer the question about the impacts of our diet on the world’s water we need to unpack the numbers and think about potential impacts.
Firstly, how much of the total volume of water is “green” water (that is, rain water used by plants at the point where the rain falls)? Most British and Irish beef, for example, is largely fed on grass and grains that have been grown using rainfall only. We can argue that this water has a very low opportunity cost. If we stopped raising animals on that land, something else would be growing there (whether another crop, forest or natural vegetation) that would use at least as much water as the grass did and it would not make a substantial difference to the amount of water available in the basin for domestic, industrial and environmental uses. Secondly, what is the potential impact of using “blue” water (that is, water withdrawn from rivers, lakes and aquifers) on the availability of water for other users in the basin? 1 m3 withdrawn from a place (or time of year) with plentiful water resources has a much lower potential impact than 1 m3 withdrawn from a place where freshwater resources are scarce.
To be meaningful, a “footprints” should convey a message about the potential impact of an activity on a vulnerable receptor. For example a “carbon footprint” tells us something about the impact of an activity on greenhouse gas emissions and the potential contribution to global climate change. The example of carbon is relatively simple as the potential impact of the emission of 1 t CO2eq in one place is the same as the emission of 1 t CO2eq somewhere else. ISO 14046 has set out a rigorous framework for the assessment of the impact of human activities on water and Brad Ridoutt has presented a very useful blog-post about the standard. This definition of water footprint (which is fundamentally different to the very blunt accounting procedure above) provides a useful metric to help businesses (and others) to understand water-related risks in their supply chain; identify hotspots; benchmark performance; and communicate environmental performance to non-technical stakeholders. So, what can this tell us about the sustainability of our diet?
The modern western diet is rich in its diversity with foods coming from all round the world and grown in different agricultural systems; these will all have different potential impacts on water. Recently, we looked at the potential impact of the UK diet on water scarcity (Hess, et al. 2015. Food Policy, 50: 1-10) using the approaches of ISO14046. In total, we estimated that 56.2 Gm3 of water is consumed each year to support the diet of the UK. That is equivalent to 2,400 litres per person per day. However, most of this is from rain-fed agriculture, and the “blue” water consumed in supporting the UK diet is only 160 litres per person per day - which by coincidence is almost the same as the average daily per capita water use in our homes.
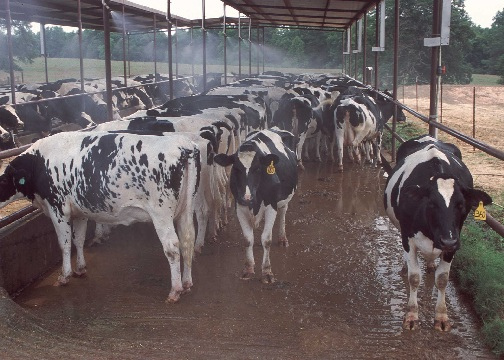
 The largest consumption of blue water is used to produce milk (and therefore also processed dairy produce). This includes the water that is; drunk by animals; used for cooling in the dairy parlour; used for wash-down of yards; and a small amount used in irrigated crop products in feed-rations. Most of the blue water used to provide the UK’s dairy produce is withdrawn in the UK and Ireland.
In terms of the total volume of blue water consumed to support the UK diet, dairy is followed by rice, citrus fruit, pig meat and sugar. Two-thirds is associated with food imports and is water that is consumed outside of the UK. Much of this is from water-stressed locations. By weighting water consumption by water scarcity we can estimate the “water stress footprint” associated with different foods. Dairy is still highest, due to the high volume of dairy produce consumed in the UK, but we can identify “hotspots”, such as rice from northern India, oranges from Spain and South Africa, vegetables from Egypt, and grapes (as wine) from Australia, where the UK diet has the highest potential impact on freshwater resources.
We also considered the impacts on global water scarcity of a change to a more “healthy” diet (i.e. in this case along the lines recommended by the UK government’s Eatwell plate). A scenario which considered a plausible reduction national consumption of protein (especially meat) and fatty and sugary foods, with increases in fruit and vegetables, starchy carbohydrates and dairy products, resulted in a small (2.5%) reduction in the total blue water consumption, but no change in the water scarcity footprint. The large reduction in blue water footprint of beef (-37%) and sugar (-50%), for example, was compensated by an increase associated with dairy (+25%), rice (+38%) and fruit (+6%) produced in more water stressed locations of the world. In other words, less blue water would be  appropriated to feed the UK, but more of the water would be consumed in locations that are water stressed.
In the example above, we assumed that the mix of individual foods within a food group, and sourcing locations, remain the same with a more healthy diet. However, consumers have choices between substitutable foods that may have very different water scarcity footprints. For example, within the group “starchy carbohydrates”, a serving of Italian pasta has three times the water scarcity footprint of a serving of British potatoes, whilst a serving of Basmati rice has a water scarcity footprint 250 times that of British potatoes (Hess, et al. 2016. Journal of Cleaner Production, 112: 4558-4568). Therefore a diet with a higher consumption of starchy carbohydrates does not necessarily mean and increase in water stress footprint.
It is clear that, from the perspective of water, the potential impact of dietary choices on the environment is the result of a complex interplay of factors. A healthy and sustainable diet depends not only on what and how much you eat, but where, how and when the food was produced. Of course, this also needs to be set against the potential impacts of dietary choices on greenhouse gas emissions, biodiversity and livelihoods.
Enjoy your dinner!
To read more, we suggest that you take a look at the paper discussed above, which Tim Hess lead authored: “The impact of healthier dietary scenarios on the global blue water scarcity footprint of food consumption in the UK”.
The citation is as follows:
Hess, T., Andersson, U., Mena, C., Williams, A., (2015).The impact of healthier dietary scenarios on the global blue water scarcity footprint of food consumption in the UK, Food Policy, Volume 50, , Pages 1–10
We welcome your comments on this post (and Brad’s earlier post). You can submit a comment below by logging in as a member. Do not hesitate to get in touch if you have forgotten your login details. We encourage you to register as a member (for free) to make use of the other networking benefits on the website.


Post a new comment »