Resource
Sixteen years of change in the global terrestrial human footprint and implications for biodiversity conservation
There is increasing evidence that human demands on natural systems are accelerating and could affect the stability and services provided by these systems. This paper aims to aid understanding of the temporal and spatial variability of human pressures on natural systems, which provides a foundation for environmental damage mitigation. Recent advances in remote sensing have allowed great development in mapping of human pressures, particularly in forested areas. Other pressures, such as roads and pasture lands, have by comparison been overlooked.

This study aims to quantify, with a 1km2 resolution, the cumulative human footprint on the terrestrial environment from 1993 to 2009. The human footprint has increased by 9% in these years, despite the 23% increase in population and 153% increase in the world economy. 75% of the earth’s land is experiencing human pressures, which is increasing in intensity over time.
The authors used methods developed by Sanderson et al., (2002) to create human footprint estimates on a national scale, and rated each human pressure on a scale of 1-10. The human pressures included are:
- The extent of built environments – urban areas that do not provide viable habitats for many species of conservation concern, and do not provide high levels of ecosystem services. These were assigned a pressure score of 10.
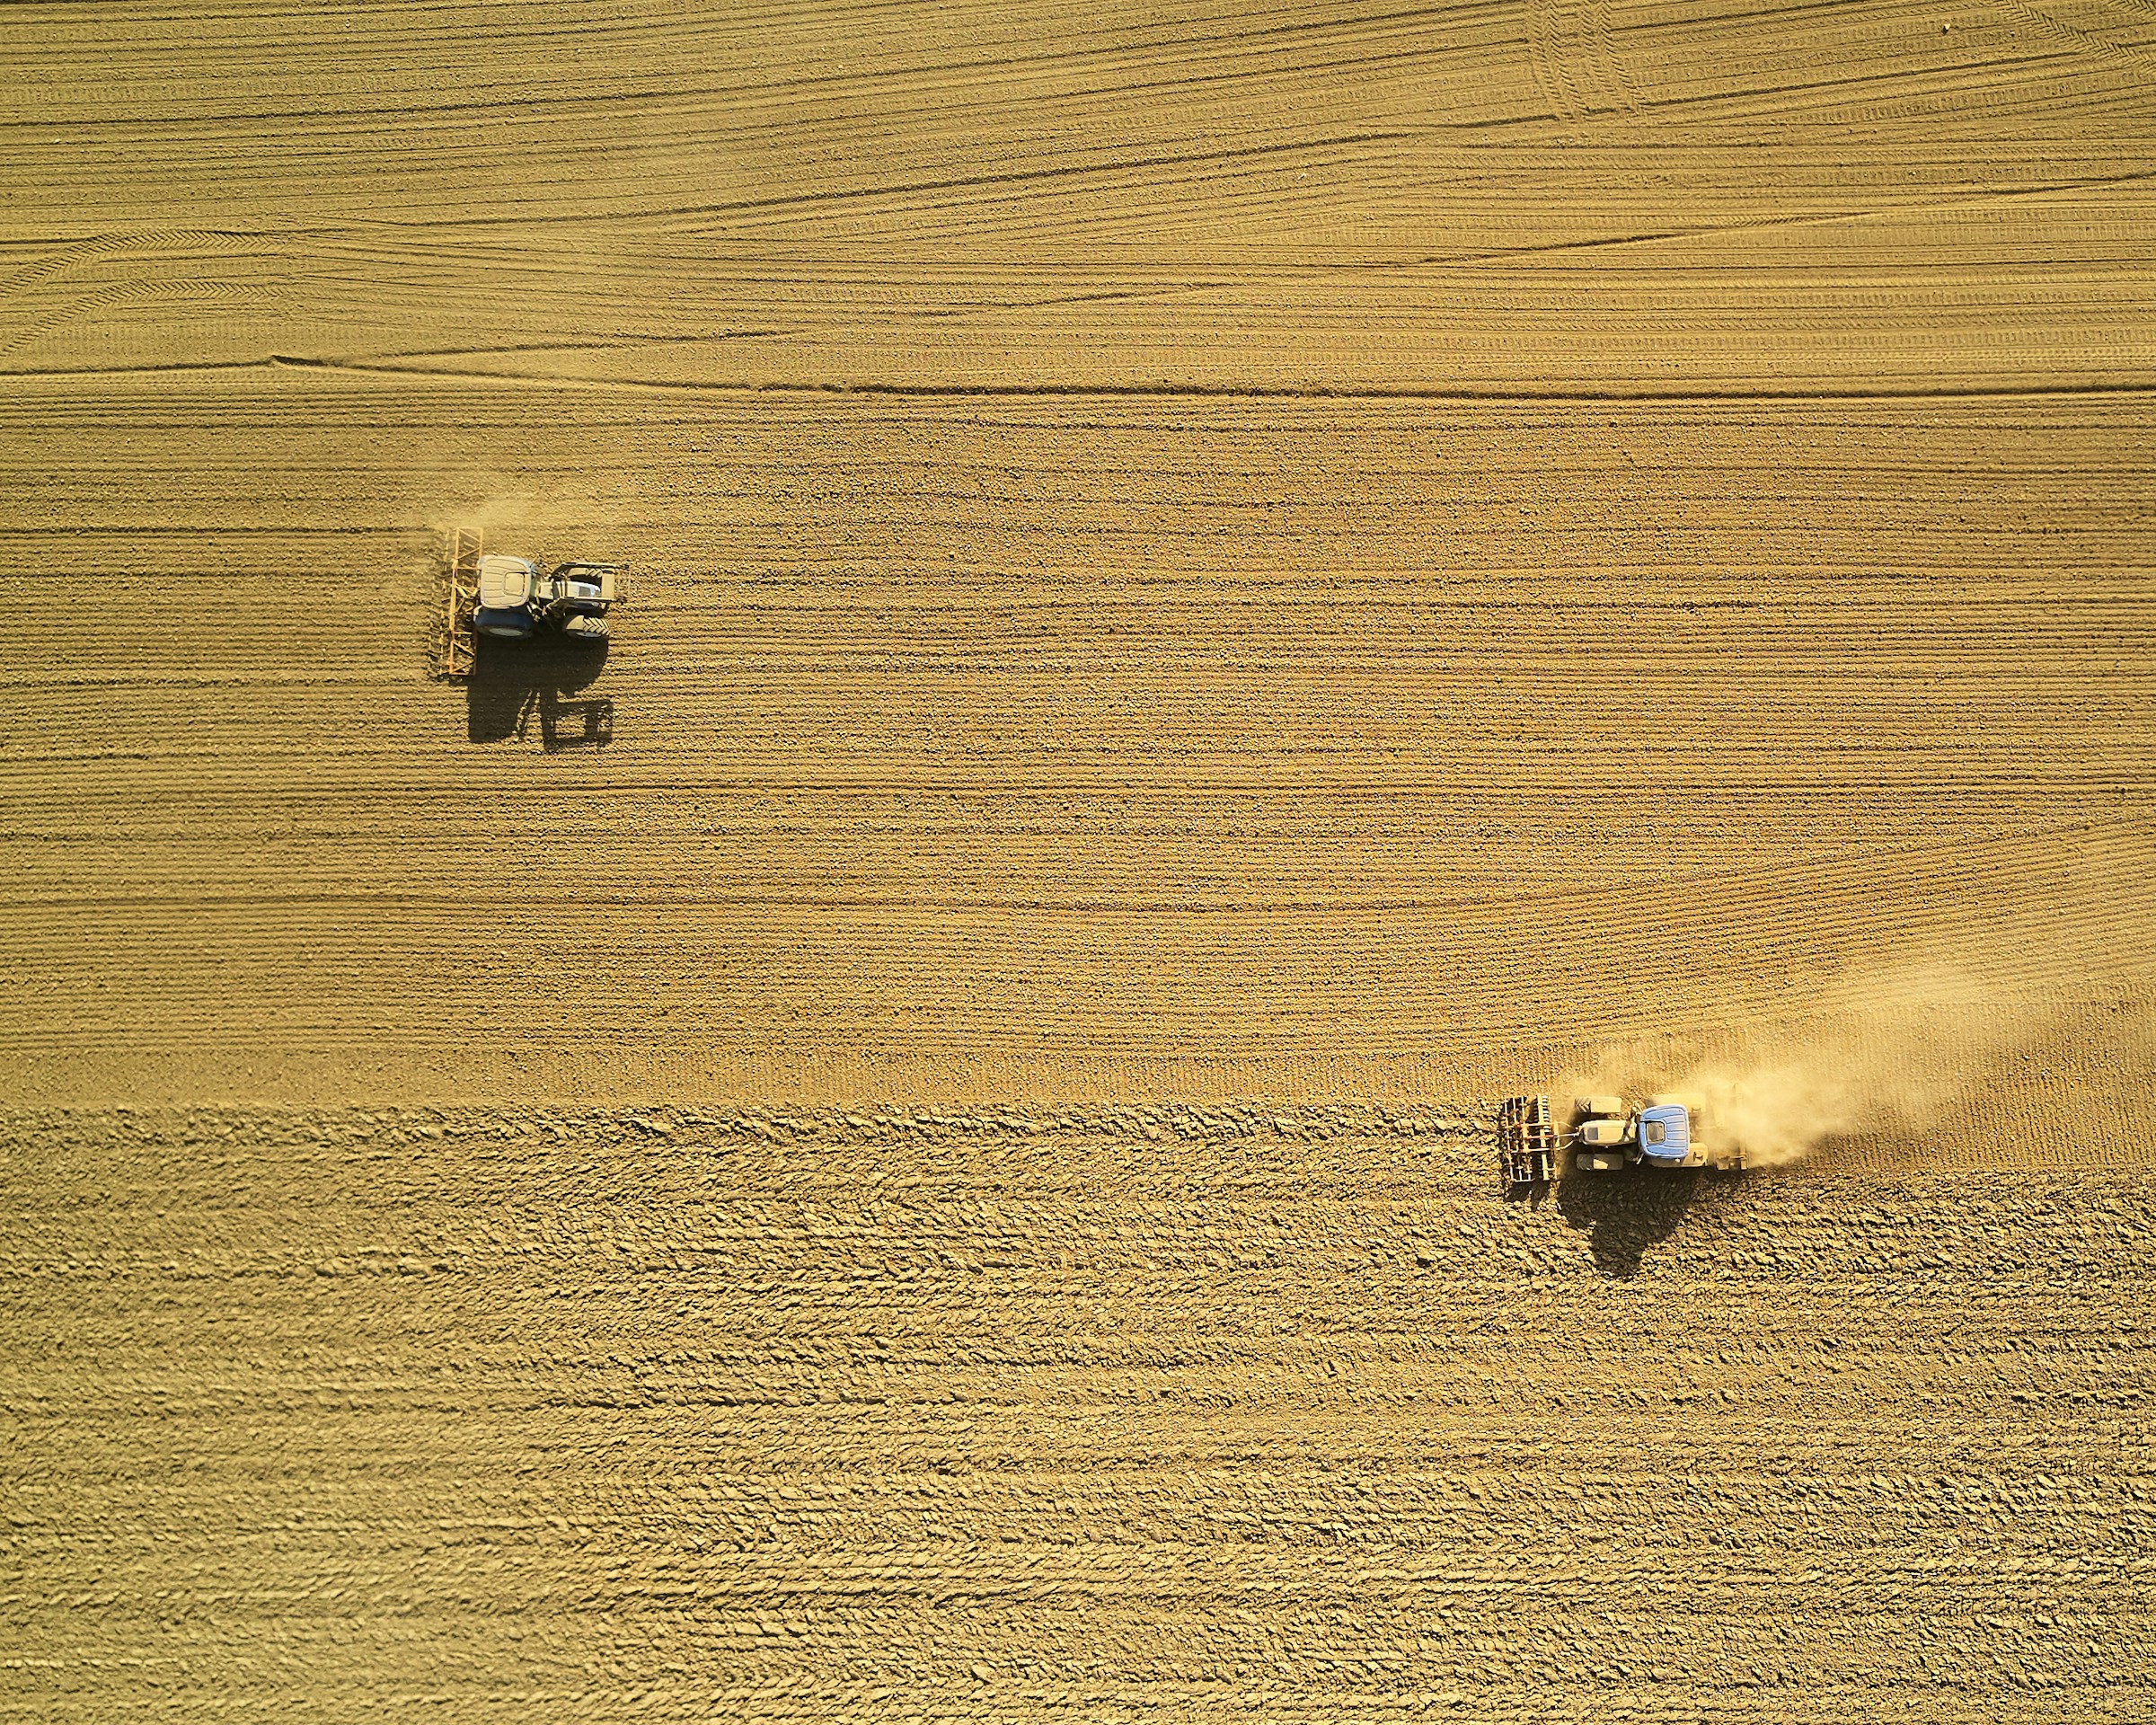
- Cropland – focused mainly on intensive agriculture because of its greater pressure on the environment and to circumvent the shortcomings of using remotely sensed data which confounds agricultural mosaics and natural woodland/savanna.
- Pasture land – see Cropland. Pasture lands cover 22% of the earth’s land making it one of the most extensive direct human pressures. This was assigned a pressure score of 4, which was then scaled from 0 to 4 using the percent pasture for each 1 km2 pixel.
- Human population density - >1000 people per km were assigned a pressure score of 10
- Night-time lights – pressure score varied from 0-10
- Railways – assigned a pressure score of 8 for 0.5km either side of the railway
- Roads - assigned a pressure score of 8 for 0.5 km out for either side of roads, and access pressures were awarded a score of 4 at 0.5 km and decreasing exponentially out to 15 km either side of the road.
- Navigable waterways - access pressure from navigable water bodies was awarded a score of 4 adjacent to the water body, with the score decreasing exponentially out to 15 km.
These were weighted according to estimates of their relative levels of human pressure, which can co-occur in one location. Pasture lands, roads and railways were treated as static pressures as temporal data were unavailable.
The study authors determined the contribution of each of the 8 pressures to the overall human footprint. They also compiled national-scale datasets of determine if over-the-horizon consumption, socio-economic transition, urbanization or governance can explain the difference in footprint trajectories among the most rapidly expanding economies.
They found that in 2009, the world’s land areas had an area-weighted average human footprint score of 6.16 out of a maximum 50, with an increase of 9% from 1993. They also find strong spatial variation; the highest pressure biomes are forested areas, and 27% (9% less than 20 years prior) of the world’s non-Antarctic area had no measurable human footprint.

573 out of 823 ecoregions have an increase in average footprint value, and 223 ecoregions appear to have decreasing values (primarily in temperate zones in North America and Western Europe). Only 3% of 772 ecoregions saw declines in human pressure >20%, whereas 71% saw average increases of 20% or more.
Suitability of land for agriculture was found to have a very strong relationship with cumulative human pressures, but this relationship is not straightforward; change in human pressure since 1993 shows a U shaped pattern, perhaps as highly suitable lands were saturated prior to 1993 and so agricultural expansion has primarily occurred on less suitable lands.
Biodiversity hotspots and areas that contain high numbers of threatened species are under high human pressure; areas of no pressure cover <3% of the world’s biodiversity hotspots and 2% of threatened vertebrate concentrations.
There has been a decrease in human pressures in wealthy countries, which optimistically could indicate an environmentally sustainable future. More pessimistically, this at least in part due to the outsourcing of these human pressures - for example 40% of beef produced in the Amazon is exported to the EU. Crop and pasture lands were found to be the leading causes of land conversion. In conclusion, the human footprint is changing both spatially and temporally; our footprint is increasing, but the rate of this has slowed. Increases in human footprint are being seen in developing nations, and some developed countries are actually reducing their footprint in time.
Abstract
Human pressures on the environment are changing spatially and temporally, with profound implications for the planet’s biodiversity and human economies. Here we use recently available data on infrastructure, land cover and human access into natural areas to construct a globally standardized measure of the cumulative human footprint on the terrestrial environment at 1 km2 resolution from 1993 to 2009. We note that while the human population has increased by 23% and the world economy has grown 153%, the human footprint has increased by just 9%. Still, 75% the planet’s land surface is experiencing measurable human pressures. Moreover, pressures are perversely intense, widespread and rapidly intensifying in places with high biodiversity. Encouragingly, we discover decreases in environmental pressures in the wealthiest countries and those with strong control of corruption. Clearly the human footprint on Earth is changing, yet there are still opportunities for conservation gains.
Citation
Venter, O., Sanderson, E.W., Magrach, A., Allan, J.R., Beher, J., Jones, K.R., Possingham, H.P., Laurance, W.F., Wood, P., Fekete, B.M. and Levy, M.A., 2016. Sixteen years of change in the global terrestrial human footprint and implications for biodiversity conservation. Nature Communications, 7.
Read the full article here (open access)
You can read related research by browsing the following categories of our research library: Land Footprint, Food & Agriculture Policy and Landscape Biodiversity.

Comments (0)