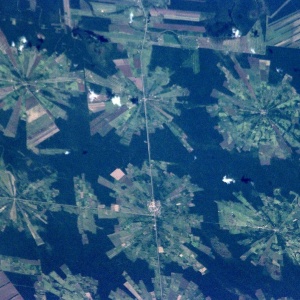
This paper presents maps of global land use change from 1992 to 2015, showing net increases in the area of agriculture, grassland and settlement, and net losses in the area of forest, wetland, shrubland, sparse land, bare land and water.
The maps show loss of forest, mainly in tropical regions but also in Russia, Canada, Scandinavia and Baltic countries, which is mainly attributed to the conversion of forest to agricultural land, shrubland and grassland. However, there are also areas of forest gain, particularly in northern Russia, northern Canada, and in Africa.
Areas of cropland expansion are found mainly in northern Kazakhstan, southern Russia, northern Iran, the Sahel region in Africa, northern Algeria, northeastern China, and New South Wales in Australia.
Abstract
Monitoring global land cover changes is important because of concerns about their impact on environment and climate. The release by the European Space Agency (ESA) of a set of worldwide annual land cover maps covering the 1992–2015 period makes possible a quantitative assessment of land change on the global scale. While ESA land cover mapping effort was motivated by the need to better characterize global and regional carbon cycles, the dataset may benefit a broad range of disciplines. To facilitate utilization of ESA maps for broad-scale problems in landscape ecology and environmental studies, we have constructed a GIS-based vector database of mesoscale landscapes – patterns of land cover categories in 9 km × 9 km tracts of land. First, we reprojected ESA maps to the Fuller projection to assure that each landscape in the database has approximately the same size and shape so the patterns of landscapes at different locations can be compared. Second, we calculated landscape attributes including its compositions in 1992 and 2015, magnitude of pattern change, categories transition matrix for detailed characterization of change, fractional abundances of plant functional types (PFTs) in 1992 and 2015, and change trend type – a simple, overall descriptor of the character of landscape change. Combining change trends and change magnitude information we constructed a global, thematic map of land change; this map offers a visualization of what, where, and to what degree has changed between 1992 and 2015. The database is SQL searchable and supports all GIS vector operations. Using change magnitude attribute we calculated that only 22% of total landmass experienced significant landscape change during the 1992–2015 period, but that change zone accounted for 80% of all pixel-based transitions. Dominant land cover transitions were forest → agriculture followed by agriculture → forest. Using PFTs attributes to calculate global aggregation of gross and net changes for major PFTs yielded results in agreement with other recent estimates.
Reference
Nowosad, J., Stepinski, T.F. and Netzel, P., 2018. Global assessment and mapping of changes in mesoscale landscapes: 1992–2015. International Journal of Applied Earth Observation and Geoinformation. In press, corrected proof.
Read the full paper here (global maps can be found in the supplementary data). See also the Foodsource building block What is land use and land use change?


Post a new comment »